

01
An Adequate Response? The RBI’s Rate Hike, Supply-Side Inflation and the Government’s Share of the Burden
Core TopicEditorialGS-III · Economy — Monetary Policy, Inflation, Food ManagementPrelims + MainsThe Hindu · Editorial
The editorial accepts the MPC’s 25-bps hike and shift to “calibrated tightening” as a sound move, but argues that when inflation is driven by oil prices and a deficient monsoon, interest rates can only work at the margin — chiefly by anchoring expectations. The main work, it contends, now lies with the Government’s supply-side tools.
◈ Basics First — Not All Inflation Is Alike
Inflation is a sustained rise in the general price level. Its source determines which policy tool works. Monetary policy acts mainly on aggregate demand; it cannot produce more oil or vegetables.
- Demand-pull inflation — too much spending chasing limited output; interest-rate hikes are effective because they cool credit-financed demand.
- Cost-push (supply-side) inflation — rising input costs or supply shocks (crude oil, crop failure); rate hikes reduce output further without fixing supply.
- Imported inflation — higher world prices or a weaker rupee raise the cost of imports such as crude oil and edible oils.
- Headline vs core — headline CPI includes volatile food and fuel; core inflation excludes them and signals underlying demand pressure.
- Inflation expectations — if households and firms expect higher prices, they demand higher wages and set higher prices, making inflation self-fulfilling. The RBI tracks them through its Inflation Expectations Survey of Households.
Static Background — The Framework in Brief
- Flexible Inflation Targeting (FIT) — statutory since the RBI Act amendment of 2016; target 4% CPI with a tolerance band of 2–6%. Missing the band for three consecutive quarters counts as a failure, and the RBI must report reasons and remedies to the Centre.
- “Flexible” means the MPC must also keep growth in view — the classic growth–inflation trade-off.
- Fuel pricing — petrol prices were deregulated in 2010 and diesel in 2014; in practice, oil marketing companies (OMCs) often hold retail prices steady during spikes, absorbing losses that eventually burden public finances.
Figure 1 — RBI’s CPI Inflation Projections for 2026-27 against the Target Band
6% upper4% target2% lower0%4.9%6.0%5.7%Q2 (Jul–Sep)Q3 (Oct–Dec)Q4 (Jan–Mar)Aug proj. 4.7%Shaded: 2–6% tolerance band · projections as cited in the editorial
Projected inflation climbs to the upper edge of the band in Q3 — the context for a pre-emptive hike aimed at expectations rather than at the oil and food shocks themselves.
The Editorial’s Argument
- The drivers are on the supply side — crude has crossed $100 a barrel again, and a deficient monsoon is pushing up food prices; OMCs have so far held back most of the fuel-price increase.
- A rate hike works at the margin — against supply shocks it has only second-order effects; it is “a careful nudge rather than an ineffectual bludgeon”.
- The signal matters most — the stance change to calibrated tightening tells markets that the question is no longer whether rates rise in December but by how much.
- Growth confidence — the RBI raised its 2026-27 GDP forecast to 7.1% (from 6.7%), though most agencies foresee a second-half slowdown.
- External side — higher rates may slow the exit of Foreign Portfolio Investors, giving the rupee some relief.
- The onus shifts to the Government — to use its food-management and supply tools more effectively.
◈ The Government’s Supply-Side Toolkit
- Buffer stocks — FCI stocks of wheat and rice; the Price Stabilisation Fund (2014-15) for pulses and onions.
- Open Market Sale Scheme (OMSS) — the FCI sells grain from central stocks in the open market to cool prices (distinct from the RBI’s open market operations in bonds).
- Trade measures — cutting import duties (e.g. on edible oils) and restricting exports.
- Anti-hoarding — stock limits on traders under the Essential Commodities Act, 1955.
- Fiscal levers — adjusting excise duty on petrol and diesel to cushion retail prices.
Critical Assessment
- Strength — the editorial rightly identifies expectations management as the real channel of monetary policy during supply shocks; un-anchored expectations can turn a temporary shock into persistent inflation.
- Lag effect — monetary policy acts with a lag of several quarters; by the time it bites, the oil or food shock may have reversed, needlessly slowing growth.
- Trade-offs in supply tools — export bans and stock limits hurt farm incomes and India’s reputation as a reliable exporter; duty cuts cost revenue.
- Fiscal–monetary coordination — suppressed fuel prices delay inflation but transfer the cost to OMC balance sheets and the fiscal deficit; transparency about who bears the shock is needed.
✎ Mains Practice Question
“When inflation is driven by supply shocks, monetary tightening is a necessary signal but an insufficient remedy.” Discuss with reference to the recent policy action of the RBI, and suggest the fiscal and administrative measures that should complement it. 15 marks · 250 words
ExplainedConcept Explainers · Agriculture, Energy & Trade
02
Why Edible Oils Lead Food Inflation: Biodiesel Mandates, El Niño and Black Sea Disruptions
Core TopicExplainedGS-III · Economy — Agriculture, Food Security, Energy · GS-I Geography (El Niño)Prelims + MainsThe Indian Express · Explained
The FAO Food Price Index averaged 136 points in September 2026, its highest since November 2022; within it, the vegetable oil index hit 198.6. The explainer traces this to three converging forces — biofuel mandates that divert oil from food to fuel, an intensifying El Niño, and the Russia–Ukraine war choking Black Sea exports.
◈ Basics First — Vegetable Oils, Biodiesel and Price Indices
- Major vegetable oils — palm (from the oil palm fruit), soybean, rapeseed/canola and sunflower. Indonesia and Malaysia together produce the large majority of the world’s palm oil.
- Biodiesel (FAME) — vegetable oils are converted into Fatty Acid Methyl Esters by transesterification: the oil’s triglycerides react with methanol in the presence of a catalyst, yielding FAME and glycerol as a by-product. FAME can be blended with petroleum diesel.
- Blending notation — B20 means diesel with 20% biodiesel; similarly, E20 is petrol with 20% ethanol.
- FAO Food Price Index — compiled by the Food and Agriculture Organization (founded 1945, HQ Rome); base 2014–16 = 100; five sub-indices: cereals, vegetable oils, dairy, meat and sugar.
Figure 2 — The Vegetable Oil Price Cycle and Indonesia’s Palm Oil Balance
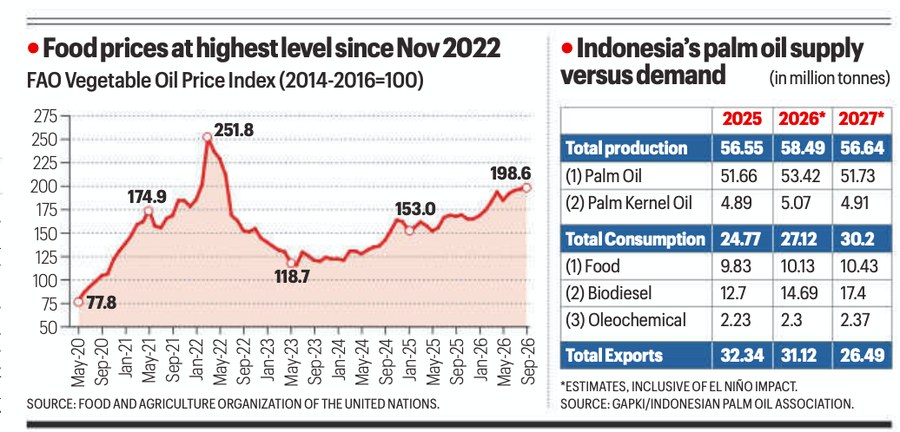
After the post-invasion spike (251.8, March 2022) and a slump, prices have climbed again since 2024. Image courtesy The Indian Express, October 2026 (sources: FAO; GAPKI); reproduced with credit for educational use.
Force 1 — Food-to-Fuel Diversion
Biofuel mandates compel fuel retailers to blend a minimum share of biofuel, creating a guaranteed, price-insensitive demand for vegetable oils.
Industry estimates put roughly a quarter of world soybean oil and over a quarter of palm and rapeseed oil into biodiesel. High crude prices — Brent above $100 — make diversion even more attractive.
- Indonesia — the world’s largest palm oil producer and the first country to mandate 50% blending (B50, July 2026). Its biodiesel use of palm oil is projected to rise from 12.7 mt (2025) to 17.4 mt (2027), while exports may fall from 32.3 mt to 26.5 mt.
- Malaysia — B10 nationwide since September 2019; phased roll-out of B15 from June 2026.
- United States — about 8.07 mt (54%) of a projected 14.94 mt soybean oil output in 2026–27 directed to biofuels.
- European Union — about 6.1 mt (57.2%) of 10.67 mt rapeseed oil diverted to biodiesel and bio-ATF.
Figure 3 — Indonesia’s Biodiesel Blending Staircase
B20B20B30B35B40B502016Sep 2018Jan 2020Aug 2023Jan 2025Jul 2026limited scalenationwideworld’s first B50Malaysia: B10 nationwide (Sep 2019) → phased B15 (from Jun 2026)
Each step up the staircase absorbs more palm oil at home; B40 → B50 alone is projected to take an extra 4.7 mt off the export market.
Force 2 — El Niño
- What it is — the warm phase of the El Niño–Southern Oscillation (ENSO): unusual warming of the central and eastern equatorial Pacific, which weakens the trade winds and shifts rainfall patterns.
- Typical effects — drier conditions over Indonesia, Malaysia and Australia, and a tendency towards a weaker Indian monsoon.
- Current episode — already “very strong”, expected to peak in October–December and persist till March–April.
- Lagged impact on palm — water-stressed oil palms abort female flowers and young fruit bunches, so yields fall 8–12 months later; Indonesia’s output is projected to dip from 58.5 mt (2026) to 56.6 mt (2027).
Force 3 — War and Logistics
- Russia and Ukraine are the world’s two leading sunflower producers; their 2026–27 crops are larger (21 mt and 13 mt of seed), but exports are blocked.
- Navigation through the Sea of Azov (linked to the Black Sea by the Kerch Strait) has stopped since 10 July, and Black Sea port operations are suspended; alternatives via the Baltic, Caspian, Far East or rail are costly and congested.
- Static peg: the UN- and Türkiye-brokered Black Sea Grain Initiative (July 2022 – July 2023) had earlier kept Ukrainian exports moving.
The India Angle — The World’s Largest Edible Oil Importer
India depends on imports for close to two-thirds of its edible oil consumption. Domestic production is estimated to fall from 9.7 mt (2025-26) to 9.2 mt (2026-27) because of El Niño, pushing imports to a record 17.2 mt — about 8.2 mt palm, 5 mt soybean and 3.5 mt sunflower oil.
Figure 4 — India’s Edible Oil Supply: Domestic Output vs Imports
2025-262026-27 (est.)Domestic 9.7 mtImports 16.8 mt (≈63%)Domestic 9.2 mtImports 17.2 mt (≈65%) — recordImport share computed from the trade estimates cited (domestic + imports = total supply)
A small fall in domestic output translates into a record import bill just as landed prices of palm, soybean and sunflower oil rise.
◈ Static Background — India’s Oilseed Policy
- Nine annual oilseeds — groundnut, rapeseed-mustard, soybean, sunflower, sesame, safflower, niger, castor and linseed; mostly rain-fed, hence monsoon-sensitive.
- Yellow Revolution — the Technology Mission on Oilseeds (1986) made India nearly self-sufficient by the early 1990s, before import liberalisation reversed the trend.
- National Mission on Edible Oils — Oil Palm (2021) — outlay ₹11,040 crore, focus on the North-East and Andaman & Nicobar Islands.
- National Mission on Edible Oils — Oilseeds (2024) — outlay ₹10,103 crore for 2024-25 to 2030-31, targeting a sharp rise in primary oilseed output by 2030-31.
- India’s own biofuel policy — the National Policy on Biofuels (2018, amended 2022) targets 5% biodiesel blending in diesel by 2030, with feedstock drawn mainly from non-edible oils and used cooking oil.
Critical Assessment
- Food vs fuel — producer countries pursue energy security and lower oil-import bills; importers bear higher food prices. Biofuel policy is thus also trade policy.
- Vulnerability of concentrated sourcing — India’s reliance on two palm suppliers and on Black Sea sunflower oil exposes household budgets to decisions and conflicts abroad.
- Policy dilemma at home — lowering import duties eases consumer prices but depresses prices for domestic oilseed farmers, undermining the self-reliance missions.
- Way forward — higher-yield oilseed varieties, assured procurement and price support, area expansion under oil palm with ecological safeguards, diversified import sources, and promoting non-food feedstocks for biodiesel.
✎ Mains Practice Question
“Biofuel mandates in producer countries are turning edible oil into an energy commodity.” Examine how this, along with climatic and geopolitical factors, affects India’s food security, and suggest a strategy to reduce India’s import dependence for edible oils. 15 marks · 250 words