

Editorials, Opinions & Explained2 Items
Core TopicImportantConcise
OpinionsSigned Op-Eds · GS III
01Next Farm Revolution: From Food Security to Farmers’ Incomes
ExplainedData & Context · GS II
02RTI Act at 21: Gaps in Proactive Disclosure (Section 4)
OpinionsSigned Op-Eds & Columns
01
Beyond Food Security: Why the Next Farm Revolution Must Target Farmers’ Incomes
Core TopicOpinionGS-III · Agriculture — Irrigation, Food Security, Buffer Stocks, Farm Incomes, Agri-TradePrelims + MainsThe Indian Express · From Plate to Plough (Ashok Gulati)
An agricultural economist looks back at 25 years of farm policy, first in Gujarat (2001-02 to 2013-14) and then at the national level (2014-15 to 2025-26). His conclusion is that India has largely secured food security in staples. The open problem is the next one: significantly raising farmers’ incomes.
◈ Basics First — Output, Growth and Income Are Not the Same
- Agricultural growth: the yearly change in the real Gross Value Added (GVA) of agriculture and allied sectors. It measures the value of output, not the income of each farmer.
- Farmers’ income: what an agricultural household earns from crops, livestock, wages and non-farm business. It can stay flat even when GVA rises, because of four factors:
- output prices may fall;
- input costs may rise;
- landholdings keep shrinking;
- more people remain dependent on the same land.
- Food security: the FAO framework defines it through four dimensions:
- availability of food;
- access to food;
- utilisation of food;
- stability of the first three over time.
- Buffer-stocking norms: the Government sets the minimum stocks of rice and wheat that the Central Pool should hold at the start of each quarter. Stocks far above these norms tie up working capital and add storage costs.
◈ Static Background — The Arc of Indian Agricultural Policy
- 1960s: the Green Revolution combined HYV seeds, fertiliser, irrigation, MSP and procurement. The Food Corporation of India and the Agricultural Prices Commission were both set up in 1965.
- 1970 onwards: Operation Flood (the White Revolution) built India’s dairy sector through the cooperative model. It was followed by other sectoral “revolutions”: the Yellow (oilseeds) and the Blue (fisheries).
- Narmada: the Narmada Water Disputes Tribunal gave its award in 1979. The Sardar Sarovar Project in Gujarat is the terminal dam on this west-flowing river, which runs through a rift valley between the Vindhya and Satpura ranges.
- 2002: the Genetic Engineering Appraisal Committee (GEAC) approved Bt cotton, India’s first GM crop approved for commercial cultivation.
- 2016: the Union Government set a target of doubling farmers’ income by 2022. An inter-ministerial committee, whose report was completed in 2018, mapped out a strategy covering productivity, costs, prices and diversification.
- Income data: the latest NSO Situation Assessment Survey (77th Round, 2018-19) estimated the average monthly income of an agricultural household at ₹10,218. Of this, about 40% came from wages and only about 37% from crop cultivation.
- Small holdings: the Agriculture Census 2015-16 put the average holding at 1.08 ha. About 86% of holdings were small or marginal.
◈ Constitutional Anchor
- Agriculture (Entry 14), water and irrigation (Entry 17) and markets and fairs (Entry 28) are in the State List. This is why most farm reforms depend on the States.
- Trade and commerce in foodstuffs falls under Entry 33 of the Concurrent List.
- Inter-State river waters are covered by Entry 56 of the Union List and by Article 262, under which the Inter-State River Water Disputes Act, 1956 was enacted.
- Article 48 (Directive Principles): the State is to organise agriculture on modern and scientific lines.
The Argument of the Op-Ed — In Brief
The Gujarat phase (2001-02 to 2013-14): the author credits Gujarat with farm growth of over 9% a year, a rate he says was rare even in Punjab at the height of the Green Revolution. He traces the growth to infrastructure and technology rather than to price support.
- Water: check dams and a larger share of Narmada waters for irrigation.
- Power: separate electricity feeders for irrigation and for rural homes, so that farm power came reliably and at predictable hours. This was Gujarat’s Jyotigram Yojana (2003).
- Roads: rural roads connecting farmers to markets.
- Extension: the Krishi Mahotsav campaigns, which brought officials and private firms to villages to demonstrate technology.
- Technology: the spread of Bt cotton after its approval in 2002.
The national phase (2014-15 to 2025-26): this phase began with back-to-back droughts in 2014 and 2015, which the author notes had happened only three times in a century. He says policy responded by prioritising irrigation and crop insurance through the PM Fasal Bima Yojana.
- Irrigation: close to 60% of gross cropped area is now irrigated.
- Rice: India is the largest producer and exporter of rice.
- Stocks: even after giving 5 kg of free foodgrain per person per month under the PM Garib Kalyan Anna Yojana, stocks stand at more than four times the buffer norm for rice and nearly three times the norm for wheat.
- Trade (2025-26): agri-exports of about US$ 33 billion, led by rice and marine products, against agri-imports of about US$ 40 billion, mainly edible oils and pulses.
- Growth: agricultural GDP grew by about 4% a year on average from 2014-15 to 2025-26.
The thesis: the next farm revolution must be judged by whether it significantly raises farmers’ incomes, and not only by output or food security.
Figure 1 — From production-led growth to an income-led agenda
Gujarat, 2001-02 to 2013-14growth above 9% a year (as cited)India, 2014-15 to 2025-26about 4% a year (as cited)The next phasegoal: farmers’ incomesWater: check dams,Narmada watersPower: separate feedersfor farms and homesRoads to marketsExtension: KrishiMahotsavTechnology: Bt cotton(approved 2002)Irrigation: about 60% ofgross cropped areaCrop insurance: PMFBYFree foodgrains: 5 kgper person per monthStocks well abovebuffer normsLargest rice producerand exporterHigh-value farming:horticulture, livestock, fishMarket and price reform:stable trade policyInput subsidiesmoved to direct transfersFPOs, processing,value chainsAgri R&D, climate resilienceColumns 1–2 summarise the op-ed’s account; column 3 lists levers commonly debated in policy literature (Legacy analysis)
Both earlier phases relied on supply-side infrastructure: water, power, insurance and stocks. The third phase requires demand-side and market reforms.
▤ The Numbers in the Op-Ed (as cited)
9%+
Gujarat farm growth, 2001-14
~4%
All-India farm GDP growth, 2014-26
~60%
Gross cropped area irrigated
4× / 3×
Rice / wheat stocks vs buffer norm
Reading Between the Lines — An Analytical View
- Surplus is not prosperity: stocks three to four times the buffer norm are a sign of over-procurement of rice and wheat. They lock in the paddy–wheat cycle, raise the food subsidy and carrying costs, and weaken the incentive to diversify. Food security has become a problem of managing surpluses.
- Irrigation that depends on groundwater: much of the gain in irrigated area comes from tubewells. Groundwater supplies roughly three-fifths of irrigation, and free or flat-rate power in many States encourages over-extraction. Separating farm and household feeders is a tool for rationing farm power as well as supplying it.
- The trade gap points to oilseeds and pulses:
- On the cited figures, India runs an agri-trade deficit of about US$ 7 billion, driven by edible oils and pulses.
- These are exactly the crops targeted by the National Mission on Edible Oils: Oil Palm (2021) and Oilseeds (2024).
- They are also targeted by the Mission for Aatmanirbharta in Pulses (2025).
- Four per cent is respectable, not transformative: national growth of about 4% is less than half Gujarat’s reported rate. A diverse, largely rainfed country cannot simply replicate the model of one State.
- Where incomes are actually made: the faster-growing parts of agriculture are livestock, fisheries and horticulture. Policy, however, remains centred on cereals, MSP and input subsidies.
Figure 2 — India’s agri-trade balance, 2025-26
India’s agricultural trade, 2025-26 (US$ billion, as cited)Exportsled by rice, marine products~33Importsmainly edible oils, pulses~40On these cited figures, imports exceed exports by about US$ 7 billion.
The import bill is dominated by edible oils and pulses. Self-reliance in these two crop groups is the most direct way to turn the agri-trade balance positive. Figures as cited in the op-ed.
A Critical View of the Argument
- Base effects: growth rates measured over a period that starts in drought-affected years tend to look higher. Long-run trend comparisons are more reliable than averages over a tenure.
- What caused the growth: farm output also depends on the monsoon, global prices and technologies that were cleared nationally, such as Bt cotton. Not all of it can be traced to State policy.
- Ecological costs: expanding irrigation brings aquifer depletion, soil degradation and fertiliser imbalance. These costs are not captured in GVA.
- Out-of-date income data: the most recent farm-income survey is from 2018-19, and the 2022 income-doubling target was never formally assessed. Without regular income data, any income-centred agenda is hard to measure.
Way Forward — Levers for an Income Revolution
- Diversify into high-value farming, supported by cold chains, food processing and export infrastructure.
- Reform price policy: adopt predictable trade rules, use stock limits and export bans only rarely, and supplement MSP with price deficiency payments.
- Rationalise input subsidies: move fertiliser, power and water subsidies towards direct benefit transfers that do not depend on how much input is used.
- Aggregate small farmers through FPOs (the 10,000 FPO scheme, 2020) and cooperatives, so they gain bargaining power in markets.
- Invest in R&D, climate-resilient seeds and digital agriculture (AgriStack), and create rural non-farm jobs so that fewer people depend on farming.
◆ Prelims Pointers
- Jyotigram Yojana (Gujarat, 2003) separated agricultural feeders from rural domestic feeders.
- The GEAC functions under the Ministry of Environment, Forest and Climate Change. Its rules derive from the Environment (Protection) Act, 1986.
- PMFBY began in Kharif 2016. Farmers’ premium is 2% of sum insured for Kharif, 1.5% for Rabi food and oilseed crops, and 5% for commercial and horticultural crops.
- PMGKAY began in 2020. Since 1 January 2024, it provides free foodgrains to NFSA beneficiaries for five years.
✎ Mains Practice Question
India has achieved food security in staples, yet farm incomes remain low and stagnant. Discuss why gains in agricultural production have not translated into proportionate gains in farmers’ incomes, and suggest a strategy for an income-centred agricultural transformation. 15 marks · 250 words
ExplainedData Point · Text & Context
02
RTI Act at 21: Why the Promise of Proactive Disclosure Remains Unfulfilled
Core TopicExplainedGS-II · Governance — Transparency & Accountability, RTI, Statutory Bodies (CIC)GS-IV · Probity — Information SharingPrelims + MainsThe Hindu · Data Point
The Right to Information Act, 2005 completed 21 years on 12 October 2026. The Act had two intended routes to information: filing a request, and proactive (suo motu) disclosure by government bodies. A data analysis shows that the second route remains weak. As a result, requests and appeals keep piling up.
◈ Basics First — How the RTI Act Works
- Constitutional basis: the right to know is part of freedom of speech and expression under Article 19(1)(a). The Supreme Court recognised this in State of U.P. v. Raj Narain (1975) and S.P. Gupta v. Union of India (1981). The RTI Act puts this right into statute.
- Key definitions: “Information” is defined in Section 2(f) and “public authority” in Section 2(h). Every public authority must designate Public Information Officers (PIOs) under Section 5.
- Section 4 (proactive disclosure): public authorities must publish information on their own, without waiting for requests.
- Section 4(1)(b) lists 16 specific categories, plus a residual clause for other prescribed information (clauses i–xvii).
- The categories include functions and duties, officials’ contact details, budgets and expenditure, subsidy programmes and concessions granted.
- Sections 6 and 7 (requests): a citizen files an application, and the PIO must reply within 30 days, or within 48 hours where the life or liberty of a person is involved.
- Exemptions: Section 8 lists the grounds for refusing information. Section 24, read with the Second Schedule, excludes listed intelligence and security organisations, except for information on allegations of corruption and human-rights violations.
- Appeals and penalties: an applicant can file a first appeal within the public authority and a second appeal to the Central or State Information Commission (Section 19). Under Section 20, a PIO can be fined ₹250 a day, up to ₹25,000.
- The Commissions: the Central Information Commission is set up under Section 12 and State Information Commissions under Section 15. Under Section 25, each Commission prepares an annual report, which is laid before the legislature.
Figure 3 — Two channels of access under the RTI Act
CHANNEL 1 — PROACTIVE (SUO MOTU) DISCLOSURE · SECTION 4Public Authoritypublishes Sec 4(1)(b) items+ DoPT additional categoriesWebsite / recordsopen to all, no applicationCitizeninformed directlyVerified annually by a third-party transparency audit, with the report shared with the CICCHANNEL 2 — REQUEST AND APPEAL · SECTIONS 6, 7, 19Citizen filesrequest (S.6)fee ₹10 (Centre)PIO replies (S.7)30 days; 48 hours iflife or liberty involvedFirst appealsenior officer withinthe same authoritySecond appealCIC / SICwithin 90 daysEvery item missing from Channel 1 pushes a citizen into Channel 2,which is where request volumes and Commission backlogs accumulate
Section 4 is meant to be the main channel, so that citizens rarely need to file a request. When it is weak, the burden shifts to PIOs, appellate authorities and the Commissions.
◈ Static Background — The Making of the Transparency Regime
- 1766: Sweden enacted the world’s first freedom-of-information law, as part of its Freedom of the Press Act.
- 1990s: the Mazdoor Kisan Shakti Sangathan (MKSS) in Rajasthan held jan sunwais (public hearings) on records of local public works. The National Campaign for People’s Right to Information (NCPRI) was formed in 1996.
- 1997–2003: several States passed their own RTI laws first, beginning with Tamil Nadu and Goa in 1997.
- 2002: Parliament passed the Freedom of Information Act, but it was never brought into force.
- 2005: the RTI Act received assent on 15 June 2005 and came fully into force on 12 October 2005.
- 2006: the Second Administrative Reforms Commission devoted its First Report to the RTI Act, describing it as the “master key to good governance”.
- 2013: DoPT guidelines added categories for proactive disclosure (such as procurement, PPPs, transfer policy and RTI applications received). They also introduced an annual third-party transparency audit.
- 2019: the RTI (Amendment) Act allowed the Centre to prescribe the tenure, salary and service conditions of Information Commissioners. These had earlier been fixed in the Act itself, at parity with the Election Commission.
- 2019 (judiciary): in Anjali Bhardwaj v. Union of India, the Supreme Court directed timely and transparent appointments to Information Commissions. In CPIO, Supreme Court v. Subhash Chandra Agarwal, it held that the office of the CJI is a public authority under the Act.
- 2023: Section 44(3) of the Digital Personal Data Protection Act amended Section 8(1)(j) of the RTI Act, widening the personal-information exemption. The change removed the earlier public-interest override for such information.
What the Data Analysis Found
2,303
Public authorities registered with CIC
62.7%
Submitted transparency audits, 2024-25
33 / 94
Department sites with 2024-25 audit
~23 lakh
RTI requests handled, 2024-25
- Audit submission: according to the CIC Annual Report 2024-25, about 1,443 of the 2,303 registered public authorities (62.7%) submitted third-party transparency audit reports. About 37% did not submit any.
- Audit quality: more than half of the reports submitted were graded C or below, meaning a score of 80% or less. Grade E means a score below 60%.
- Improving trend: the number of authorities submitting audits roughly doubled, from 754 (2020-21) to about 1,443 (2024-25).
- Website check: the newspaper verified the websites of the 94 departments under which these authorities fall.
- Only 33 carried the 2024-25 audit report.
- 56 (nearly three-fifths) had largely complied with Section 4, with information for 2025-26.
- 26 lacked the mandated information.
- The Ministry of Social Justice and Empowerment site had none.
- Request volume: about 23 lakh RTI requests were handled in 2024-25. About 5.1 lakh (22%) of these were carried over from the previous year. Both new requests and pending requests have risen steadily since 2007-08.
Figure 4 — Audit compliance (Chart 1) and RTI request load (Chart 2)
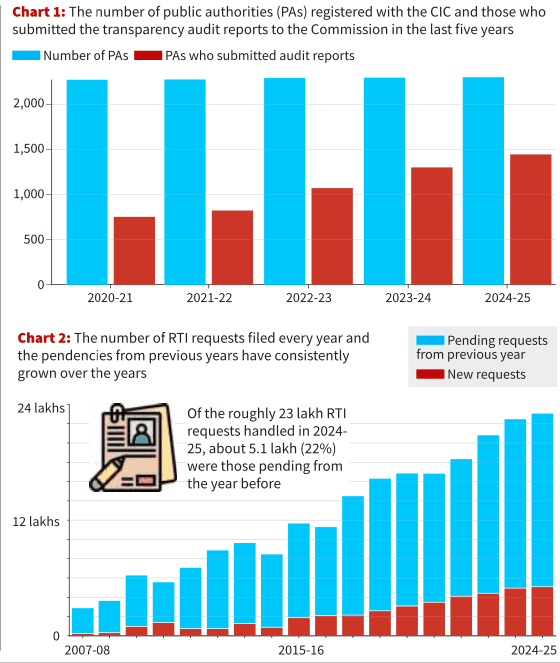
Chart 1: audit submission is rising, but more than a third of authorities still do not file. Chart 2: the total RTI load has grown steadily. Per the newspaper’s note, about 5.1 lakh of the roughly 23 lakh requests in 2024-25 were carried over. Image courtesy The Hindu, 12 October 2026; reproduced with credit for educational use.
Figure 5 — How 94 Union department websites fare on proactive disclosure
A. Section 4 disclosures on 94 department websites56 — largely compliant, 2025-26 data~1226 — not availableminimal or datedThe middle segment is derived as the remainder (94 − 56 − 26) and is not stated directly in the article.B. Transparency audit report for 2024-25 uploaded on the website33 — yes (35%)61 — no current report (65%)Each bar shows all 94 departments. Source data: The Hindu’s independent verification, reported 12 October 2026.
Only about one in three departments puts its latest audit on its website. More than a quarter do not publish the information that Section 4 makes mandatory.
Why Section 4 Matters
- The Act’s own design: Section 4(2) asks public authorities to disclose enough on their own that the public has minimal need to file requests. Strong proactive disclosure is the Act’s intended first line of access.
- Lower pendency: each item published proactively reduces the number of requests, first appeals and second appeals, and so eases the backlog at the Commissions.
- Equal access: applying for information takes time, literacy and some confidence in dealing with officials. Published information is equally available to everyone.
- Accountability: published procurement, budget and beneficiary data enables social audit, deters corruption and supports evidence-based scrutiny.
- Global commitment: the measure supports SDG Target 16.10, which concerns public access to information.
Implementation Gaps — An Analytical View
- No penalty for non-disclosure: the Section 20 penalties apply to how PIOs handle requests, not to failures to disclose under Section 4.
- The Commission may recommend corrective steps under Section 25(5).
- While deciding an appeal, it may direct a public authority to publish categories of information under Section 19(8).
- There is no routine mechanism to enforce compliance with Section 4.
- Audits as box-ticking: self-arranged third-party audits, with more than half graded C or below and many not published, risk becoming a formality rather than a real check.
- Outdated information: some websites hold old or partial information. Section 4 requires regular updates, so stale data defeats its purpose.
- Format problems: information is often posted as scanned PDFs instead of machine-readable data. This falls short of the National Data Sharing and Accessibility Policy (2012) and the open-data approach behind data.gov.in.
- Institutional weakness: vacancies in the Commissions, delayed appointments and the dilution of Commissioners’ independence through the 2019 amendment all weaken enforcement of the Act.
- A narrower Act: the DPDP Act’s change to Section 8(1)(j) widens the scope for refusing information. This makes proactive disclosure of non-personal public data even more important.
Way Forward
- Give Section 4 compliance legal force through rules, with Commission oversight and departmental accountability for failures to disclose.
- Have the CIC empanel independent auditors, publish grade-wise rankings of public authorities, and require audit reports on department websites.
- Build a standard, machine-readable disclosure template on a single national portal, with automatic date-stamps so that stale data is visible.
- Use RTI request patterns to decide what to publish: information that is requested often should be published by default.
- Fill Commission vacancies on time, as the Anjali Bhardwaj directions require, and publish pendency data quarterly.
◆ Prelims Pointers
- Section 4 covers proactive disclosure. Section 8 covers exemptions. Section 24 covers excluded organisations. Section 25 covers the Commissions’ annual reports.
- The Chief Information Commissioner is appointed by the President on the recommendation of a committee of three:
- the Prime Minister;
- the Leader of the Opposition in the Lok Sabha;
- a Union Cabinet Minister nominated by the Prime Minister.
- The CIC is a statutory body, not a constitutional one. It has no suo motu power to penalise a public authority for Section 4 lapses.
- The time limit for a second appeal to the CIC or a SIC is 90 days.
✎ Mains Practice Question
“Proactive disclosure under Section 4 was meant to be the backbone of the RTI regime, yet it remains its weakest link.” Examine this statement in the light of recent compliance data, and suggest measures to strengthen suo motu disclosure. 15 marks · 250 words