

Editorials, Opinions & Explained2 Items
Core TopicImportantConcise
OpinionsGS II · GS III
01India–New Zealand FTA — Opportunities and Utilisation02Disinvestment, Privatisation & Fiscal Strategy
OpinionsSigned op-eds, analysed with static background and counter-views
01
India–New Zealand FTA Enters Into Force: Market Access, Services Mobility and the Utilisation Challenge
Core TopicOpinionGS-II · IR — Bilateral Agreements, Indo-PacificGS-III · Economy — External Sector, Trade PolicyPrelims + MainsThe Hindu · Op-Ed (industry chamber perspective)
With the India–New Zealand Free Trade Agreement now in force, the author — writing from an industry-chamber perspective — argues that preferential access can lift India’s small share of New Zealand’s imports in labour-intensive goods, engineering, pharmaceuticals and services, but that gains will depend on how effectively businesses use the agreement.
◈ Static Background — FTAs and India’s Trade Strategy
- What an FTA is: an agreement under which members reduce or eliminate tariffs on substantially all trade among themselves — permitted under Article XXIV of GATT as an exception to the Most-Favoured-Nation principle. Services coverage falls under Article V of GATS.
- Terminology: India uses labels such as CECA, CEPA, ECTA and TEPA for agreements of varying depth; modern FTAs cover goods, services, investment, mobility, regulatory cooperation and sometimes sustainability.
- Rules of origin: determine which goods qualify for concessions, preventing third-country goods from being routed through a partner.
- India’s recent wave: after leaving RCEP negotiations (2019), India signed agreements with Mauritius (2021), the UAE (2022), Australia (ECTA, 2022), the EFTA states (TEPA, 2024) and the UK (2025), among others.
- New Zealand: a member of both RCEP and the CPTPP, with a population of about 5 million, of whom roughly 5–6% are of Indian origin; its largest exports are dairy and other agricultural products.
Figure 1 — New Zealand: location and main cities
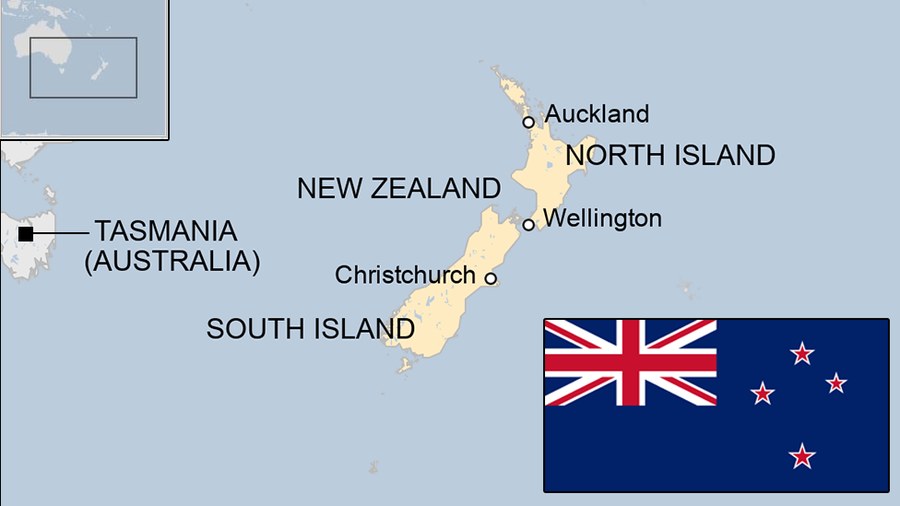
Two main islands — North Island (Auckland, the largest city; Wellington, the capital) and South Island (Christchurch) — separated by the Cook Strait; Australia lies across the Tasman Sea. Schematic map; not to scale. Map reproduced with credit for educational use.
Figure 2 — Who supplies New Zealand’s merchandise imports (~$47.5 billion)
China22%+Australia, US, S. Korea,Japan (combined)~33%India1.9%Most leading suppliers (except the U.S.) already had preferential access
Bars drawn to scale. Chart recreated by Legacy IAS from figures cited by the author.
▤ The Agreement — Key Features (as described)
- Goods: duty-free access for Indian exports across New Zealand’s tariff lines; elimination of apparel tariffs averaging about 10%.
- Pharmaceuticals: acceptance of regulatory evaluation and inspection reports from recognised regulators, reducing duplicate compliance.
- Services: commitments in 118 sub-sectors, including IT, professional services, health, education and finance.
- Mobility: up to 5,000 skilled-professional visas at any time, with stays of up to three years; improved student mobility and post-study work.
- Investment: New Zealand to facilitate $20 billion of FDI into India over 15 years — a model similar to the investment commitment in the India–EFTA TEPA.
- Current scale: bilateral merchandise trade of about $1.2 billion; India supplies under 3% of New Zealand’s $24.2 billion services imports.
The Author’s Argument
- Level playing field: competitors with existing FTAs enjoyed an edge; preferential access removes India’s tariff disadvantage.
- Labour-intensive sectors first: apparel (India’s share only about 4% of New Zealand’s ~$1.2 billion imports), leather, footwear, home textiles, carpets.
- Higher-value manufacturing: New Zealand imports about $7 billion of machinery and $5.2 billion of vehicles and parts, where India’s share is about 1% or less.
- Utilisation is the key: market intelligence, distribution networks, regulatory preparedness and a pipeline of investment projects; doubling bilateral trade by 2030 is described as feasible.
Analysis and Counter-Views
- Small market, strategic value: New Zealand’s economy is small; the agreement’s significance lies as much in Indo-Pacific engagement, services mobility and investment as in goods trade volumes.
- Sensitive sectors: India’s agriculture and dairy — where New Zealand is a global leader — are livelihood-critical; India is reported to have kept dairy outside its tariff concessions, reflecting the balance between market access and domestic protection.
- Low FTA utilisation: studies have found that Indian exporters use preferences under existing FTAs at relatively low rates because of rules-of-origin compliance costs and limited awareness — supporting the author’s emphasis on utilisation.
- Trade-deficit concerns: past FTAs (notably with ASEAN) widened India’s trade deficit; outcomes depend on the competitiveness of Indian producers, not only on tariff cuts.
- Perspective: the article reflects an industry viewpoint; an academic assessment would also weigh adjustment costs, labour and environmental provisions, and the distribution of gains.
✎ Mains Practice Question
India has signed a series of “new-generation” trade agreements after stepping away from RCEP. Using the India–New Zealand FTA as an example, discuss the opportunities such agreements offer and why their utilisation by Indian businesses has often been limited. 15 marks · 250 words
02
Disinvestment as Economic Strategy: From Revenue Tool to Reform of Public Enterprise
Core TopicOpinionGS-III · Economy — Fiscal Policy, Public Sector Enterprises, Resource MobilisationPrelims + MainsThe Hindu · Op-Ed (industry chamber perspective)
Disinvestment receipts reached 78% of the year’s ₹80,000 crore target by September, and the approved strategic sale of IDBI Bank could push collections past it. The author — writing for an industry body — argues that disinvestment should be treated not as a deficit-filling device but as a reform strategy, and proposes a demand-led, time-bound “Privatisation 2.0” framework.
◈ Static Background — Disinvestment in India
- Meaning: disinvestment is the sale of part of the Government’s equity in a public enterprise; privatisation (strategic sale) transfers management control along with a majority stake.
- Lineage: began after 1991; the Rangarajan Committee (1993) recommended guidelines; a Department of Disinvestment was set up in 1999, renamed DIPAM (Department of Investment and Public Asset Management) in 2016, under the Ministry of Finance.
- Methods: Initial Public Offer, Offer for Sale (OFS) via stock exchanges, strategic sale, buybacks, and exchange-traded funds (CPSE ETF, Bharat-22 ETF).
- New Public Sector Enterprise Policy (2021): in four strategic sectors — atomic energy, space and defence; transport and telecom; power, petroleum, coal and minerals; banking, insurance and financial services — a bare minimum presence of PSEs; in non-strategic sectors, PSEs are to be privatised or closed.
- Landmarks: strategic sale of Air India (2022); LIC IPO (2022), which drew many first-time retail investors.
- Accounting: disinvestment proceeds are non-debt capital receipts — they reduce the borrowing needed to fund the fiscal deficit.
Figure 3 — Disinvestment and monetisation receipts, April–September 2026 (₹ crore)
Full-year target80,000Total mobilised (H1)62,124of which disinvestment55,757 (78%)The approved IDBI Bank strategic sale is expected to take receipts past the target
Bars drawn to scale. Chart recreated by Legacy IAS from DIPAM figures cited by the author.
▤ The Fiscal Context (as cited)
- Revenue: net tax revenue up 3.4% and non-tax revenue up 3.2% in April–August 2026.
- Spending: capital expenditure up over 18%; fiscal deficit at 42% of the budget estimate.
- Monetisation: a target of ₹16.72 lakh crore under National Monetisation Pipeline 2.0 for FY26–30, after achieving about 90% of Phase 1 (2021–25).
- Fiscal anchors: the FRBM Act, 2003, and the Centre’s shift towards a debt-to-GDP target as its medium-term anchor.
The Author’s Argument
- Beyond the deficit: disinvestment unlocks value, widens public ownership and improves governance through market discipline.
- From OFS to strategic sales: OFS broadens ownership but leaves management unchanged; the IDBI sale — the first strategic sale since Air India — is described as a step towards “Privatisation 2.0”.
- Two reforms: (i) a demand-based choice of PSEs, prioritising those that attract strong bids; (ii) a rolling three-year privatisation pipeline for better due diligence and price discovery.
- Calibrated stake reduction: an industry estimate suggests reducing the Government’s stake to 51% in 95 listed PSEs could raise about ₹9 lakh crore while keeping majority control; a dedicated body could manage the process.
- Caveat: none of this justifies fiscal complacency; prudence is needed to protect spending on health and education without crowding out private investment.
Analysis and Counter-Views
- “Family silver” debate: critics argue that selling profitable assets to meet annual targets trades long-term dividend income for one-time receipts; proceeds are best used for capital formation, not recurring expenditure.
- Track record: disinvestment targets have frequently been missed, and some announced privatisations — such as BPCL and two public sector banks — have stalled, reflecting valuation, regulatory and political-economy hurdles.
- Market capacity: large stake sales across many PSEs at once could create a supply overhang and depress prices.
- Public interest: in strategic sectors, social objectives (rural banking, energy security) may justify continued State ownership; governance reform of PSEs — board autonomy, professional management — is an alternative path.
- Perspective: the article presents an industry viewpoint; an academic assessment weighs efficiency gains against employment, competition and regulatory capacity after privatisation.
✎ Mains Practice Question
“Disinvestment should be an instrument of public sector reform, not merely a means of meeting fiscal targets.” Critically examine this statement in the light of India’s disinvestment experience and the New Public Sector Enterprise Policy, 2021. 15 marks · 250 words