
Contents01
NITI Aayog Investment Friendliness Index: Benchmarking State-Level Investment Ecosystems
NITI Aayog · Released 17 July 2026
GS 2GS 3
02
Modified UDAN: Strengthening India’s Regional Aviation Network
Ministry of Civil Aviation · Launched 4 July 2026
GS 2GS 3
Article 01
Article 01
NITI Aayog Investment Friendliness Index: Benchmarking State-Level Investment Ecosystems
NITI Aayog · Released 17 July 2026
Relevance: GS 2 (Governance, federalism, government policies, statutory and non-statutory bodies) · GS 3 (Indian economy, investment, infrastructure, inclusive growth, competitive federalism).
GS 2GS 3
Key Data at a Glance
36States and UTs assessed (28 States + 8 UTs)
84indicators across 8 pillars; no state scored 60 or above
5Top Performers (score >50): Gujarat, Maharashtra, Tamil Nadu, Goa, Odisha
56.6Gujarat’s score — highest among large states
~25%India’s investment rate as % of GDP (vs China ~40% at peak)
15States classified as Frontrunners (scores 45–50)
Issue in Brief
- NITI Aayog released the Investment Friendliness Index (IFI) on 17 July 2026 — a data-driven framework to assess how effectively States and UTs create, enable and sustain a conducive investment environment.
- Mandated at the 9th Governing Council Meeting (July 2024) and formalised in the Union Budget 2025–26, the IFI aims to foster competitive and cooperative federalism in service of Viksit Bharat @2047.
- Gujarat, Maharashtra, Tamil Nadu, Goa and Odisha are the Top Performers; rankings are also provided within three peer groups to ensure equitable comparison.
Static Background
- NITI Aayog (National Institution for Transforming India) replaced the Planning Commission in January 2015. Unlike the Commission, it is a policy advisory body and does not allocate funds to States — it produces strategies, indices and reform frameworks.
- Competitive Federalism is the principle that States compete via performance rankings to attract investment and adopt best practices — seen in earlier indices like the Ease of Doing Business (EoDB) by DPIIT and Export Preparedness Index by NITI Aayog.
- Cooperative Federalism is the complementary idea of Centre–State partnership rather than hierarchy — embodied in the GST Council model and the spirit of Article 263 (Inter-State Council).
- India’s investment rate is ~25% of GDP — well below China’s ~40% during its peak growth phase. NITI Aayog Vice Chairman Ashok Kumar Lahiri stressed at the IFI launch that private investment must drive industrialisation, innovation and employment to sustain high growth.
- The World Bank’s Ease of Doing Business index (discontinued globally in 2021 due to data irregularities) and India’s Business Reform Action Plan (BRAP) by DPIIT are the conceptual predecessors of the IFI at the sub-national level.
- Viksit Bharat @2047 envisions India as a developed nation by its centenary of independence — requiring sustained GDP growth of 8–9% annually, impossible without a step-change in both private and public investment rates.
Key Dimensions — Framework and Methodology
- IFI evaluates all 36 jurisdictions across 8 pillars: Infrastructure, Business Climate, Resources, Government Policy, Regulatory Ease, Institutional Environment, Financial Health and Environmental Resilience.
- The framework uses 84 indicators combining secondary data (government/institutional sources) with perception-based measures from a primary investor survey — capturing both policy-on-paper and ground-level business experience.
- Scores are out of 100; crucially, no State scored 60 or above — signalling deep structural investment-climate gaps even among India’s best-performing states.
- States and UTs are assessed within three peer groups: Large States · Hilly and North-Eastern States · City States and UTs — to enable contextually fair comparisons across different geographies and economic scales.
Key Dimensions — Rankings and Pillar Leadership
- Overall Top Performers (score >50): Gujarat, Maharashtra, Tamil Nadu, Goa, Odisha. Frontrunners (45–50): 15 States. Emerging Performers (40–44): 8. Aspiring States (<40): 8.
- Large States: Gujarat (1st, 56.6), Maharashtra (2nd, 53.7), Tamil Nadu (3rd). Odisha, Madhya Pradesh and Andhra Pradesh ranked 4th, 5th, 6th. Bihar, Jharkhand and West Bengal at the bottom.
- Hilly and North-Eastern States: Uttarakhand (1st, 47.5), Assam (2nd), Himachal Pradesh (3rd).
- City States and UTs: Goa (1st, 53.1), Delhi (2nd), Chandigarh (3rd). Notably Chandigarh achieved the highest infrastructure score of any jurisdiction (15/25) due to urban density advantages.
- Pillar-wise leaders among Large States: Infrastructure & Financial Health → Gujarat; Business Climate → Maharashtra; Resources → Odisha; Government Policy → Madhya Pradesh; Institutional Environment & Regulatory Ease → Chhattisgarh; Environmental Resilience → Tamil Nadu.
- Gujarat’s top infrastructure score reflects port efficiency, competitive industrial electricity tariffs and well-managed T&D (Transmission & Distribution) losses.
Critical Analysis — Strengths
- The peer-group design prevents the distortion of comparing Sikkim with Maharashtra — contextually meaningful benchmarking that earlier flat EoDB rankings lacked.
- Combining objective indicators + investor perception addresses the chronic gap between policy-as-designed and policy-as-experienced — a key flaw that ultimately discredited the World Bank EoDB methodology.
- Inclusion of Environmental Resilience as a pillar is forward-looking — aligning with ESG-driven FDI trends and India’s climate commitments under Panchamrit (COP26).
- The IFI is designed as a reform instrument, not merely a scorecard — state profiles identify specific policy gaps, enabling targeted improvements rather than generic competitive pressure.
Critical Analysis — Structural Questions
- No state crossing 60 out of 100 reveals deep structural weaknesses even at India’s best — the IFI reveals the ceiling, not just the floor of the investment climate challenge.
- Perception-based components can be gamed — states may improve survey scores through optics rather than substantive reform, similar to how EoDB rankings became subject to methodological gaming before discontinuation.
- Key investor pain points — land acquisition timelines, labour relations, judicial dispute-resolution speed — are not directly captured as standalone indicators in the publicly disclosed framework.
- NITI Aayog Vice Chairman himself clarified: “This is not a ranking exercise” — yet political signalling and media framing will make it one, risking incentive distortion toward optics over structural reform.
- Pillar weights within the composite score are not publicly disclosed — limiting independent peer review and methodological accountability.
Way Forward
- Publish full pillar weights and methodology to enable independent scrutiny and prevent gaming — transparency is non-negotiable for index credibility.
- Link IFI scores to Centre–State investment facilitation agreements so low-scoring states receive targeted technical assistance, not just rankings.
- Expand the index to capture investment retention and exit ease — attracting capital and sustaining it are distinct policy challenges requiring distinct metrics.
- Use IFI to accelerate Single Window Clearance adoption across all 36 jurisdictions — consistently cited by investors as the binding bottleneck for project commencement.
- Build in district-level data layers progressively, given investment decisions increasingly hinge on cluster-specific conditions rather than state-level averages.
Prelims Pointers
IFI released by: NITI Aayog, 17 July 2026 · Covers 28 States + 8 UTs · 84 indicators, 8 pillars.
Mandate origin: 9th Governing Council (July 2024) + Union Budget 2025–26 · Goal: competitive & cooperative federalism for Viksit Bharat @2047.
Top Performers (score >50): Gujarat (56.6), Maharashtra (53.7), Tamil Nadu, Goa (53.1), Odisha.
Peer group winners: Large States → Gujarat; Hilly/NE → Uttarakhand (47.5); City States/UTs → Goa · Chandigarh topped infrastructure (15/25).
Pillar leaders (Large States): Infrastructure/Financial Health → Gujarat · Business Climate → Maharashtra · Environmental Resilience → Tamil Nadu · Govt Policy → MP.
India’s investment rate: ~25% of GDP · NITI Aayog replaced Planning Commission, January 2015 · No state scored 60+ out of 100.
Practice Mains Question
India’s Investment Friendliness Index marks a shift from input-based to outcome-oriented federal benchmarking. Critically examine its design, significance and limitations in the context of competitive federalism and Viksit Bharat @2047.
GS Paper 2 · Governance, Federalism · 250 words · 15 marks
Practice MCQs
Q1. Consider the following statements regarding the Investment Friendliness Index (IFI): (1) It covers all 28 States and 8 Union Territories. (2) It uses 84 indicators across 8 pillars. (3) Environmental Resilience and Financial Health are among its 8 pillars. (4) States are ranked uniformly in a single national list without any peer groupings. Which are correct?
A) 1, 2 and 3 onlyB) 1 and 4 onlyC) 2, 3 and 4 onlyD) 1, 2, 3 and 4
Q2. (Assertion–Reasoning) Assertion (A): No State in India scored 60 or above in the Investment Friendliness Index. Reason (R): The IFI evaluates pillars including Environmental Resilience and Institutional Environment, where even leading States show structural weaknesses.
A) Both A and R are true, and R is the correct explanation of AB) Both A and R are true, but R is NOT the correct explanation of AC) A is true, R is falseD) A is false, R is true
Q3. Match List I (IFI pillar leadership among Large States) with List II (Leading State): A. Infrastructure · B. Business Climate · C. Government Policy · D. Environmental Resilience // 1. Madhya Pradesh · 2. Tamil Nadu · 3. Gujarat · 4. Maharashtra.
A) A-3, B-4, C-1, D-2B) A-4, B-3, C-2, D-1C) A-3, B-1, C-4, D-2D) A-2, B-4, C-3, D-1
Article 02
Article 02
Modified UDAN: Strengthening India’s Regional Aviation Network
Ministry of Civil Aviation · Cabinet Approval: March 2026 · Launch: 4 July 2026, Jodhpur Airport
Relevance: GS 2 (government policies and programmes, inclusive development, welfare schemes) · GS 3 (infrastructure, transport, Atmanirbhar Bharat, public finance, CAG audit findings).
GS 2GS 3
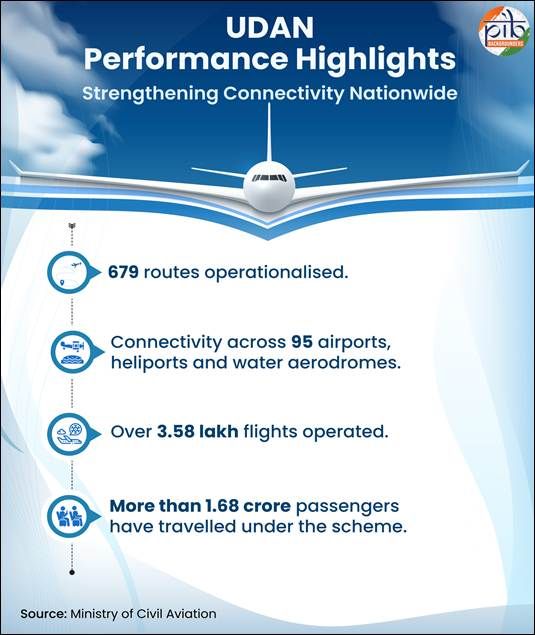
Image: Modified UDAN launch at Jodhpur Airport (4 July 2026) — ₹28,840 crore, 10-year regional aviation expansion. [Replace src with image URL]
Key Data at a Glance
₹28,840 crtotal Modified UDAN outlay (FY 2026–27 to 2035–36)
100aerodromes to be developed from unserved airstrips (₹12,159 cr over 8 years)
200modern helipads @ ~₹15 cr each (₹3,661 cr total)
5 yrsextended VGF for airlines (up from 3 yrs); tapered from year 3
679UDAN routes operational (15 July 2026); 95 airports/heliports/water aerodromes
1.68 crpassengers benefited since UDAN launch; 3.58 lakh flights operated
Issue in Brief
- The Regional Connectivity Scheme (RCS) – UDAN (Ude Desh ka Aam Nagrik — “Let the common citizen fly”) was launched in October 2016 under the National Civil Aviation Policy (NCAP) 2016 to make air travel affordable and connect Tier-2/3 cities and remote areas.
- The Union Cabinet approved Modified UDAN in March 2026; PM Modi formally launched it at Jodhpur Airport on 4 July 2026 — directly responding to a damaging CAG audit finding (2023) that the original scheme had severe route sustainability and implementation failures.
- Modified UDAN runs for 10 years (FY 2026–27 to 2035–36) with a total outlay of ₹28,840 crore, targeting 120 new destinations and 4 crore passengers over the decade.
Static Background — UDAN: Origins and Design
- UDAN was a product of NCAP 2016, India’s first comprehensive civil aviation policy. It is implemented by the Ministry of Civil Aviation through the Airports Authority of India (AAI).
- Core mechanism: Viability Gap Funding (VGF) — the government bridges the financial gap between the capped fare passengers pay and what airlines need to cover costs. Original VGF covered up to 50% of seats (max 40 seats/flight) for 3 years per route.
- Unique RCS-Levy mechanism: a small fee levied on select domestic flights funds the scheme — making aviation fund aviation. India is the first country globally to use such a sectoral self-funding model for regional connectivity.
- India is now the world’s 3rd largest domestic aviation market. Operational airports grew from 74 in 2014 to 165 as of July 2026; UDAN directly drove most of this expansion by reviving unused airstrips.
Static Background — CAG Audit: The Structural Problem Modified UDAN Solves
- The CAG’s 2023 compliance audit of UDAN (Phases 1–3, up to March 2021) found that 52% of awarded routes (403 of 774) could not commence operations at all.
- Of the 371 routes that did start, only 112 (30%) completed the full 3-year concession period. A mere 54 routes (just 7% of total awarded) remained operational after the concession ended — connecting only 17 airports as of March 2023.
- Operations were discontinued at 83 airports/heliports/water aerodromes even after spending ₹1,089 crore on their development — a fiscal waste finding that triggered the redesign.
- The CAG also flagged ticketing malpractices by certain airlines — concessional UDAN seats not made available to passengers as mandated, defeating the scheme’s core affordability objective.
- Root cause identified: the 3-year VGF window was too short for demand on thin regional routes to mature. Modified UDAN directly addresses this by extending VGF to 5 years with a tapered structure.
Key Dimensions — Five Components of Modified UDAN
- i. Development of 100 Aerodromes (₹12,159 crore, 8 years): Converting existing unserved airstrips into operational aerodromes — Tier-2/3 cities and remote regions for passenger and cargo connectivity.
- ii. Operation & Maintenance (O&M) Support (₹2,577 crore): 3-year O&M support for ~441 aerodromes — capped at ₹3.06 crore/annum per airport and ₹0.90 crore/annum per heliport/water aerodrome. Addresses the chronic under-resourcing that caused airport closures in the original scheme.
- iii. 200 Modern Helipads (₹3,661 crore): @ ~₹15 crore each, targeting regions where conventional airports are not feasible. Focus on healthcare access, emergency response and last-mile connectivity in hilly, North-Eastern and island areas.
- iv. Enhanced VGF for Airlines (₹10,043 crore, 10 years): VGF extended to 5 years; tapered from year 3 to create a glide path toward commercial viability; route exclusivity stays at 3 years to prevent monopolisation on thin corridors.
- v. Atmanirbhar Bharat — Indigenous Aircraft: 2 HAL Dhruv helicopters for Pawan Hans and 2 HAL Dornier 228 aircraft for Alliance Air — supporting domestic aviation manufacturing for remote-terrain operations under Make in India.
Key Dimensions — Operational Record and Eligibility Reforms
- As of 15 July 2026: 679 routes operational across 95 airports, heliports and water aerodromes; 3.58 lakh flights and 1.68 crore passengers served since 2016.
- Key beneficiary regions: Tezpur, Passighat, Diu, Pithoragarh, Rourkela — remote, hilly and island areas that had no regular air services before UDAN. Impact visible in tourism and healthcare access.
- Relaxed eligibility under Modified UDAN: airports with ≤14 weekly flights qualify as underserved; threshold raised to ≤21 flights for strategically vital North-Eastern and hilly states — expanding the scheme’s potential coverage.
- Passenger facilitation additions: UDAN Yatri Cafés (affordable food), Flybrary (free books) and free Wi-Fi at airports — improving the ground experience at small regional airports.
Critical Analysis — Strengths
- Extending VGF to 5 years directly addresses the CAG’s root cause finding — 3 years was demonstrably insufficient for demand on thin regional routes to become self-sustaining.
- The tapered funding structure from year 3 creates a rational glide path toward commercial viability rather than an abrupt cliff-edge withdrawal — a smarter fiscal design than the original scheme.
- O&M support for ~441 aerodromes fills a structural gap the original scheme left entirely to state and AAI budgets, whose chronic under-resourcing was a primary cause of airport closures.
- 200 helipads represent genuine last-mile thinking — recognising that conventional airports are not always feasible in the Himalayas, North-East or island territories with difficult terrain.
Critical Analysis — Structural Questions
- The CAG found only 7% of original routes were self-sustaining post-subsidy. Modified UDAN does not publicly disclose a demand-feasibility methodology for route selection — risking the same pattern with a far larger ₹28,840 crore fiscal exposure.
- Daily domestic passengers now exceed 5 lakh nationally, but this growth is concentrated on metro routes. Thin regional routes face structural demand constraints — low population density, competing road/rail alternatives — that VGF alone cannot overcome.
- The scheme does not explicitly address the CAG recommendation for independent airline audits to ensure VGF seats are sold at capped fares — the ticketing transparency gap remains a live vulnerability.
- Helipads at ₹15 crore each × 200 = ₹3,000 crore in capital; recurring operational staffing in remote terrain represents a long-term fiscal commitment without guaranteed utilisation projections.
- Alliance Air’s financial precariousness — the airline designated for HAL Dornier aircraft — raises questions about the institutional sustainability of the Atmanirbhar Bharat aviation component.
Way Forward
- Publish a demand-viability assessment methodology for every new route before VGF award — incorporating stage length, alternative transport, terrain and tourism potential, as the CAG recommended.
- Establish real-time digital monitoring of VGF seat utilisation and capped-fare compliance to prevent recurrence of ticketing malpractices documented in the CAG audit.
- Integrate helipad development with NDRF/SDRF emergency response planning so infrastructure delivers dual civilian and disaster-response utility — strengthening the cost-benefit case.
- Build a domestic MRO (Maintenance, Repair and Overhaul) ecosystem alongside indigenous aircraft deployment — without domestic MRO, HAL aircraft operations remain cost-inefficient and import-dependent for spare parts.
- Link route selection to the Aspirational Districts Programme using GIS-based route mapping to prioritise connectivity in the most underserved pockets and align aviation with the broader development convergence model.
Prelims Pointers
UDAN full form: Ude Desh ka Aam Nagrik · Launched October 2016 · Under NCAP 2016 · Ministry of Civil Aviation via AAI.
Modified UDAN: Cabinet approval March 2026 · Launch 4 July 2026, Jodhpur · 10 years (FY 2026–27 to 2035–36) · outlay ₹28,840 crore.
Component outlays: 100 aerodromes ₹12,159 cr · VGF airlines ₹10,043 cr · 200 helipads ₹3,661 cr · O&M support ₹2,577 cr.
VGF change: 3 years (original) → 5 years (modified) with taper from year 3 · Route exclusivity stays at 3 years.
Current status (15 July 2026): 679 routes, 95 airports/heliports/water aerodromes, 3.58 lakh flights, 1.68 crore passengers · India airports: 74 (2014) → 165 (2026).
CAG 2023 findings: 52% of 774 routes failed to commence · Only 54 routes (7%) survived post-concession · ₹1,089 cr spent on 83 non-operational airports · Ticketing malpractices flagged.
Atmanirbhar component: HAL Dhruv helicopters (Pawan Hans) + HAL Dornier 228 (Alliance Air).
RCS-Levy: Fee on select domestic flights to fund UDAN — first-of-its-kind sectoral self-funding model · Underserved threshold: ≤14 flights/week (≤21 for NE and hilly states).
Practice Mains Question
The Modified UDAN Scheme addresses structural failures of its predecessor while retaining its core vision of inclusive air connectivity. Critically evaluate the scheme’s redesigned framework in light of CAG audit findings and the challenges of regional aviation viability in India.
GS Paper 3 · Infrastructure, Government Schemes · 250 words · 15 marks
Practice MCQs
Q1. Consider the following about Modified UDAN (2026): (1) Approved by the Union Cabinet in March 2026 for a 10-year period. (2) VGF support to airlines extended from 3 years to 5 years. (3) The scheme proposes 200 helipads at approximately ₹15 crore each. (4) The funding model relies entirely on the Union government’s budgetary allocation with no levy on domestic flights. Which are correct?
A) 1, 2 and 3 onlyB) 2 and 4 onlyC) 1, 3 and 4 onlyD) 1, 2, 3 and 4
Q2. Which of the following were key findings of the CAG’s audit of the UDAN scheme? (1) 52% of routes awarded up to UDAN-3 could not commence operations. (2) Only 54 routes (7% of total) remained operational beyond the 3-year concession. (3) ₹1,089 crore was spent on airports where operations were subsequently discontinued. (4) Airlines universally complied with VGF seat-booking and fare-cap norms.
A) 1, 2 and 3 onlyB) 2, 3 and 4 onlyC) 1 and 4 onlyD) 1, 2, 3 and 4
Q3. (Odd One Out) Which of the following is NOT a component of the Modified UDAN Scheme?
A) Viability Gap Funding for airline operators for up to 5 yearsB) Development of 200 modern helipadsC) Construction of Greenfield airports in metropolitan citiesD) Operation and Maintenance support for ~441 aerodromes