
Published on Sep 3, 2025
Daily Current Affairs
Current Affairs 03 September 2025

Content
- Decoding the SC order on regulatory assets
- On call 24/7: a spotlight on gig workers who are running the new economy
- Made in India Vikram Processor and Semicon India 2025
- How dead birds, old maps are helping scientists track biodiversity loss
- Why do women in India face higher cancer incidence but lower mortality than men?
- Odisha’s ‘Dongar’ cultivation in danger
Decoding the SC order on regulatory assets
Basics
- DISCOMs (Distribution Companies):
State-run/private companies responsible for last-mile electricity distribution to consumers. - Annual Revenue Requirement (ARR):
- Total revenue DISCOMs are allowed to recover through tariffs + government subsidies.
- Reflects approved expenditure (power purchase, O&M, interest, depreciation, return on equity).
- Average Cost of Supply (ACS):
- Actual cost incurred by DISCOMs to supply one unit of electricity to consumers.
- Includes cost of buying power, transmission, distribution losses, etc.
- ACS-ARR Gap:
- If ACS > ARR, DISCOM makes a loss per unit supplied.
- Causes financial stress since revenue ≠ cost.
- Regulatory Asset (RA):
- Mechanism to defer recovery of revenue gap.
- SERCs allow DISCOMs to record unrecovered costs as “regulatory assets” instead of immediately increasing tariffs.
- Costs deferred for recovery in future years (with interest).
Relevance:
- GS II (Polity & Governance – Role of Judiciary in enforcing financial discipline)
- GS III (Economy – Infrastructure: Power sector, Distribution reforms, Subsidy management, Tariff rationalisation)
Supreme Court Order (2025)
- Existing regulatory assets to be cleared within 4 years.
- New regulatory assets must be liquidated within 3 years.
- Cap: RA ≤ 3% of a DISCOM’s ARR.
- Transparent recovery roadmaps to be prepared by SERCs.
- Intensive audits for DISCOMs failing to recover assets.
Why ACS-ARR Gap Persists?
- Non-cost reflective tariffs: Populist policies keep tariffs artificially low.
- Delayed subsidies: States delay subsidy transfers for agriculture/BPL households.
- Rising input costs: Sudden hikes in coal/gas prices increase power purchase costs.
- Technical & commercial losses: Theft, billing inefficiencies, high AT&C losses.
Impact of Regulatory Assets
- Short-term benefit: Tariffs don’t rise sharply, consumers shielded temporarily.
- Long-term burden: Deferred costs accumulate → future tariff shocks.
- Carrying cost (interest): Consumers ultimately pay higher than original gap.
- Cash flow stress: DISCOMs can’t pay power generators on time → risk of load shedding.
- Debt trap: DISCOMs borrow to bridge gap → rising liabilities.
- Modernisation impact: Funds locked in unrecovered costs → less investment in smart grids, renewable integration, and consumer services.
Examples
- Punjab (2003-04): First RA created (₹487 crore gap, ₹150 crore deferred).
- Delhi (2024-25):
- BSES Rajdhani: ₹36,057 crore RA.
- BSES Yamuna: ₹22,040 crore RA.
- Tata Power Delhi: ₹8,226 crore gap.
- Tamil Nadu (2021-22): ₹89,375 crore RA → systemic stress.
Consumer Impact
- Example: Delhi DISCOMs need to recover ₹16,580 crore annually within 4 years.
- With 30 billion units consumed annually, tariff hike ≈ ₹5.5/unit if immediate recovery attempted.
- Hence RAs are used, but deferred hikes become steeper over time.
Way Forward
- Tariff Rationalisation:
- Tariffs must reflect actual cost.
- Targeted subsidies for vulnerable consumers (DBT model).
- Timely Subsidy Payments:
- States should release subsidies on time → prevent revenue gap.
- Automatic Cost Pass-through:
- Mechanisms like Fuel & Power Purchase Cost Adjustment (FPPCA) allow quick tariff revision with fuel cost changes.
- Annual True-up Exercises:
- Regular reconciliation of projected vs. actual costs to avoid backlog.
- Financial Discipline:
- SERCs must enforce strict RA caps.
- DISCOMs must cut AT&C losses and improve billing efficiency.
- Grid Modernisation Financing:
- Ring-fence funds for grid upgrades, smart meters, and renewable integration separate from RA recovery.
- Judicial Oversight:
- SC’s intervention acts as a disciplinary push for States, regulators, and DISCOMs.
On call 24/7: a spotlight on gig workers who are running the new economy
Basics
- Gig Economy: A labour market characterised by short-term, contract-based, or freelance work mediated largely through digital platforms.
- Examples: Food delivery (Swiggy, Zomato), cab services (Uber, Ola), e-commerce delivery (Amazon, Flipkart), freelance IT/creative work.
- Scale:
- 7.7 million workers (2020–21) → projected 23.5 million by 2029–30 (NITI Aayog, 2022).
- India’s digital economy projected at $1 trillion in the next five years.
Relevance:
- GS II (Polity & Governance – Welfare schemes, Social security, Labour laws, Rights of workers)
- GS III (Economy – Employment trends, Informal sector, Digital economy, Future of work)
- GS I (Society – Changing urban lifestyles, Consumerism, Inequality)
- Essay/Case Study (Ethics & Society – Human dignity, Invisible labour, Tech-driven inequality)
Opportunities Created
- Job Creation: Provides income opportunities to millions, especially youth, migrants, and semi-skilled workers.
- Flexibility: Workers can choose working hours, multiple platforms, and supplement income.
- Consumer Convenience: Rapid service delivery (cabs, food, groceries) transforming lifestyles.
- Digital Inclusion: Entry point into the formal digital economy for low-skill workers.
- Post-COVID Acceleration: Pandemic pushed adoption of digital platforms and AI-enabled gig work.
Challenges for Workers
- Precarity & Insecurity: No fixed wages, job security, or guaranteed hours.
- Low Wages: Long hours for meagre earnings; often below minimum wage equivalents.
- Algorithmic Control: Workers are monitored, incentivised, and penalised by opaque algorithms.
- Lack of Social Security: No health insurance, pensions, paid leave, or accident coverage by default.
- Psychological Stress: Pressure to meet delivery targets; isolation and lack of worker identity.
- Exploitation of Aspirations: Platforms market “flexibility” but often trap workers in exploitative cycles.
Broader Social Implications
- Consumerism Boom: Instant delivery culture fuels demand but erodes human connection (faceless delivery).
- Urban Culture Shift: Traditional vendor-customer relationships replaced by impersonal transactions.
- Income Disparity: Platform owners earn exponentially compared to gig workers.
- Invisible Labour: Consumers rarely acknowledge or engage with delivery workers’ struggles.
Policy & Legal Dimensions
- Lack of Recognition: Gig workers often not categorised as “employees” under labour law.
- Social Security Code, 2020: First attempt to extend protections (like provident fund, insurance) to gig/platform workers, but implementation remains weak.
- State Responses:
- Rajasthan Gig Workers Welfare Act, 2023 – world’s first legislation creating a welfare fund for gig workers.
- Other states exploring welfare boards and data-sharing obligations for platforms.
- Unionisation & Resistance: Increasing strikes and protests by delivery and cab drivers demanding fair wages and social security.
Literary & Cultural Reflections
- Film – Zwigato (2022): Captures life of food delivery workers – insecurity, pressure, family struggles.
- Books:
- OTP Please (2025) – Voices of gig workers across South Asia, consumerism critique.
- Gig Economy in India Rising (2020) – Gig work as future of jobs, flexible but precarious.
- The Gig Economy in India (2025, Pradip Thomas) – Examines State–entrepreneur–platform dynamics.
- Global works (Gigged 2018, The Gig Economy 2019) – highlight precarity and future of work debates.
Way Forward
- Formalisation with Flexibility: Recognise gig workers as a distinct labour category with rights.
- Social Security Framework: Mandatory health, accident, and pension coverage funded jointly by platforms and governments.
- Algorithmic Transparency: Platforms must disclose rating, payment, and penalty systems.
- Collective Bargaining: Encourage unions and digital worker associations.
- Consumer Awareness: Build empathy and responsibility among users of gig services.
- Long-Term Reform: Integrate gig workers into labour codes, welfare boards, and skilling initiatives.
Made in India Vikram Processor and Semicon India 2025
Basics
- Event: Semicon India 2025 (annual semiconductor conference).
- Highlight: Union IT Minister Ashwini Vaishnaw presented PM Modi a ‘Made in India’ Vikram 32-bit Processor Launch Vehicle Grade chip.
- Developers:
- Vikram Sarabhai Space Centre (VSSC), ISRO.
- Semiconductor Laboratory (SCL), Chandigarh.
- Legacy: Upgraded version of VIKRAM1601 (16-bit processor), used in ISRO launch vehicle avionics since 2009.
Relevance:
- GS III (Science & Tech – Indigenisation of technology, Semiconductor industry, ISRO achievements, Atmanirbhar Bharat in high-tech)
- GS II (Governance – Industrial policy, Public–private–academia partnerships)
- GS III (Economy – Strategic industries, Electronics manufacturing, Supply chain resilience)
- Essay/IR (Geopolitics – Semiconductor wars, India as alternative hub vs Taiwan/China/US)
About the Vikram 32-bit Processor
- Category: Launch Vehicle Grade Microprocessor.
- Function: Used in avionics systems of ISRO’s launch vehicles.
- Upgradation: From 16-bit (VIKRAM1601) → to 32-bit (higher processing power, reliability, and efficiency).
- Significance:
- Enhances self-reliance in critical semiconductor technology.
- Reduces dependence on foreign aerospace-grade processors.
- Boosts India’s space missions (efficiency, safety, speed).
Academic & R&D Collaboration
- Memento also included 31 prototype chips developed by academic institutions:
- IIT Jammu, IIT Roorkee, IIT Dhanbad, NIT Durgapur, NIT Calicut, IIT Ropar, etc.
- Reflects strong academia–industry–government collaboration in semiconductor R&D.
India’s Semiconductor Push
- Five Semiconductor Units: Under construction rapidly.
- One pilot line already completed.
- Two more to start production in coming months.
- Policy Framework:
- Stable, investor-friendly semiconductor policies.
- Focus on covering design, fabrication, packaging, and supply chain.
- Pitch to Global Players: India projected as manufacturing hub amidst global supply chain uncertainties.
Strategic Significance
- National Security:
- Semiconductor self-sufficiency reduces vulnerability to supply chain shocks.
- Critical for defence, space, telecom, and AI systems.
- Economic Growth:
- Semiconductor industry projected as foundational for India’s $10 trillion economy target.
- Creates high-tech jobs and skilling opportunities.
- Geopolitics:
- In a world dominated by Taiwan, South Korea, U.S., and China in semiconductors → India positioning itself as an alternative hub.
Challenges
- High Capital Requirement: Semiconductor fabs need billions of dollars in investment.
- Global Competition: Taiwan (TSMC), South Korea (Samsung), U.S. (Intel), and China’s state-led push.
- Supply Chain Dependence: Raw materials, advanced lithography machinery (ASML, Netherlands) still external.
- Technology Catch-up: India is a late entrant compared to decades of global R&D.
How dead birds, old maps are helping scientists track biodiversity loss
Basics
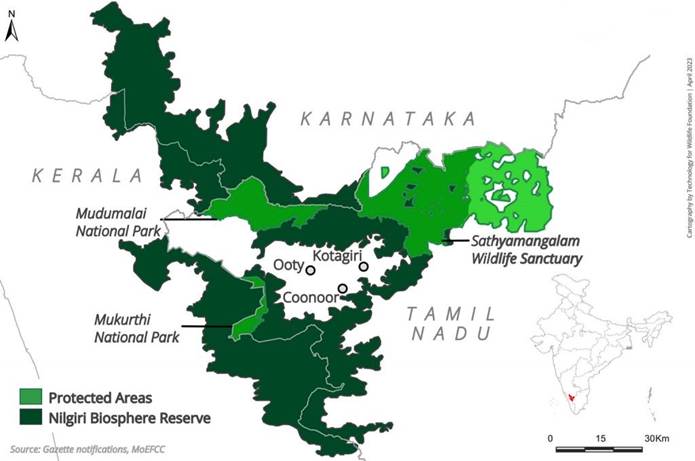
- Nilgiri Mountains: Part of Western Ghats → a global biodiversity hotspot, rich in endemic species (Nilgiri pipit, Nilgiri sholakili, Nilgiri laughingthrush).
- Biodiversity Monitoring Challenge: Current field studies show only a “snapshot”; long-term biodiversity loss requires historical baseline comparisons.
- Role of Museums & Archives: Preserve old specimens, maps, and notes → crucial for studying species decline, habitat change, and climate impacts.
Relevance:
- GS III (Environment – Biodiversity conservation, Habitat loss, Climate change impact, Grassland ecology)
- GS I (Geography – Human–environment interaction, Land-use change, Western Ghats ecosystems)
- GS I (History – Colonial records as scientific resources, Museums as repositories)
- Essay (Heritage & Ecology – Role of archives, science–society linkage in conservation)
The Study (Vijay Ramesh et al., Global Change Biology, 2025)
- Data Sources:
- Bird specimens from British-era natural history museums (late 1800s).
- Old land-use maps (e.g., Captain John Ouchterlony’s 1848 Nilgiri land-cover map).
- Contemporary field surveys across 42 sites.
- Modern satellite imagery.
- Methodology:
- Digitisation of historical museum specimens + maps.
- GIS-based land-use change analysis (1848–2018).
- Bayesian statistical tool (FAMA – field abundance–museum abundance) → estimated species’ relative abundance.
Key Findings
- Grassland Decline:
- 80% reduction → from 993 sq. km (1848) → 201 sq. km (2018).
- Grassland birds most affected: Nilgiri pipit, Malabar lark.
- 90% decline in relative abundance of grassland birds.
- Forest Birds Stability:
- 53% of forest bird species showed stable populations.
- Reason: Grasslands converted into wooded forests (plantations + invasive woody species).
- Indicates habitat “substitution” but not genuine conservation.
- Conservation Blind Spot:
- Grasslands not recognised as critical ecosystems.
- Policies & public perception focus on “forests” and tree planting → inadvertently harm grasslands.
Significance of Museums in Conservation
- Functions:
- Preserve historical records of species distribution & abundance.
- Aid taxonomy & species identification.
- Enable studies on long-term ecological changes (migration, size shifts, community collapse).
- Baseline data for conservation planning.
- Examples:
- Dead birds collected 150 years ago → now key evidence of species decline.
- Old maps digitised → show land-cover shifts invisible in short-term monitoring.
Challenges
- Access Issues:
- Most collections in Western museums (colonial legacy).
- High costs, visa barriers for Indian researchers.
- Institutional Barriers:
- Lack of digitisation in Indian archives.
- Funding constraints & bureaucratic hurdles.
- Ethical Concerns:
- Specimens collected from India but housed abroad → question of ownership & repatriation.
Broader Ecological Insights
- Grassland Neglect: Seen as “wastelands” → converted into plantations, agriculture, or urban land.
- Historical Baselines: Essential to understand true extent of biodiversity loss (short-term data underestimates decline).
- Climate Change Link: Land-use change + temperature rise → shift in ecosystems, pushing species to edge of survival.
Why do women in India face higher cancer incidence but lower mortality than men?
Understanding Cancer Incidence & Mortality
- Incidence: Number of new cancer cases diagnosed in a population during a specific time period.
- Mortality: Number of deaths due to cancer in the same period.
- Crude Incidence Rate (CIR): New cancer cases per 100,000 population.
- Age-Adjusted Incidence Rate (AAIR): Statistical measure adjusted for differences in age distribution across populations (older populations naturally have more cancer cases).
Relevance:
- GS II (Health – Public health, Disease burden, Cancer screening, Gendered healthcare inequality)
- GS I (Society – Gender issues, Women’s health & nutrition, Patriarchy in healthcare access)
- GS III (Science & Tech – Preventive healthcare, Vaccination, Epidemiology)
- Essay/Case Study (Ethics – Healthcare equity, Gender justice, Lifestyle diseases)
Current Trends in India (2015–2019, PBCR Data)
- Incidence:
- Women: 51.1% of cases (≈700,000 cases).
- Men: 48.9%.
- Mortality:
- Men: 55% of cancer deaths.
- Women: 45%.
- Most common cancers:
- Women: Breast, cervical, ovarian.
- Men: Oral, lung, prostate.
- Regional hotspot: Northeast India (Aizawl, Kamrup Urban, Papumpare, East Khasi Hills).
Why Women Face Higher Cancer Incidence
- Biological & Reproductive Factors
- Hormonal exposure (estrogen, progesterone) → breast & ovarian cancer risk.
- Delayed childbirth, fewer pregnancies, reduced breastfeeding.
- Menstrual/reproductive patterns linked to higher hormone exposure.
- Lifestyle & Environmental Changes
- Sedentary lifestyle, obesity, poor diet (processed foods, low fibre).
- Alcohol & tobacco use rising among women.
- Pollutants in air, chemicals in cosmetics, pesticides, processed foods → hormone-related cancers.
- Occupational & Social Risks
- Entry into workforce (exposure to chemicals, night shifts).
- Greater susceptibility to infections (e.g., HPV for cervical cancer).
- Gender inequality → poor nutrition, limited screening access, lower economic parity.
Why Women Have Lower Cancer Mortality
- Nature of Predominant Cancers
- Breast & cervical cancers → relatively higher survival rates if detected early.
- Breast cancer: 5-year survival >90% (early diagnosis, treatment).
- Cervical cancer: Preventable via HPV vaccination, detectable through Pap smears.
- In contrast, men’s cancers (oral, lung, liver) are highly aggressive with poor survival outcomes.
- Awareness & Screening
- Large-scale campaigns for breast & cervical screening.
- HPV vaccination drives (though limited) improving survival chances.
- Women’s reproductive health often a focus in public health interventions.
- Behavioral Factors
- Men have higher tobacco & alcohol use → aggressive cancers + late diagnosis.
- Men less likely to seek preventive healthcare compared to women.
Why Women’s Mortality is Rising Faster Now
- Healthcare Gaps: Late-stage diagnosis, poor rural access to oncology facilities.
- Socioeconomic Barriers: Costs of treatment, patriarchal decision-making limiting healthcare spending on women.
- Misdiagnosis & Delays: Symptoms ignored, stigma around breast/cervical exams.
- Double Burden: Women face biological susceptibility + structural neglect.
- Trend Projection: Over the next 2 decades, female cancer deaths projected to rise faster than men’s (Lancet 2025).
Key Takeaways
- Higher Incidence: Women more exposed to reproductive, hormonal, and lifestyle-linked risk factors.
- Lower Mortality (Currently): Women’s cancers more survivable with early detection, while men’s cancers (oral/lung) have poor outcomes.
- Alarming Trend: Mortality among women is rising quickly due to healthcare inequality, misdiagnosis, and changing lifestyles.
- Policy Priority:
- Expand HPV vaccination & cervical screening.
- Tackle environmental pollutants & unsafe cosmetics.
- Integrate cancer detection in primary health systems.
- Address gender bias in healthcare access & affordability.
Odisha’s ‘Dongar’ cultivation in danger
Dongar Cultivation
- Meaning: Dongar = traditional upland/mountain slope farming system of the Kondh tribes in Odisha.
- Method: Mixed cropping of millets, pulses, oilseeds, tubers → ensures food diversity, nutrition, and ecological balance.
- Parallels: Similar to bewar system in Madhya Pradesh’s Dindori district.
- Tools: No ploughing, only hand tools; fully organic; depends on seed exchange and community labour.
- Significance:
- Climate-resilient system.
- Ensures food sovereignty and cultural identity of Kondh tribes.
- Maintains biodiversity and soil health.
Relevance:
- GS I (Geography – Traditional farming systems, Agro-ecology, Millets, Shifting cultivation parallels)
- GS III (Environment – Sustainable agriculture, Biodiversity conservation, Climate-resilient farming)
- GS I (Society – Tribal livelihoods, Culture, Food security, Nutrition)
Rise of Eucalyptus Monoculture in Rayagada
- Agents: Outsiders linked to paper mills (mainly from southern states).
- Strategy:
- Leasing tribal lands for eucalyptus plantations.
- Providing seedlings, fertilisers, and easy loans.
- Buy-back arrangements ensure assured market.
- Spread: From lowlands → midlands → uplands (dongar areas).
- Economics: Farmers get only ₹1,500–₹3,000 per acre annually when leasing land, much below food/fodder value.
- Attractiveness: Eucalyptus is low-maintenance, grows in 5 years, requires little care compared to millet/pulse farming.
Problems of Eucalyptus Monoculture
- Food Security & Nutrition Loss
- Reduces cultivation of millets, pulses, tubers.
- Forces dependence on PDS rice + tamarind, leading to loss of nutrition.
- Decline in tribal food diversity and seed heritage.
- Ecological Impacts
- Soil Infertility: Eucalyptus depletes nutrients, reduces fertility.
- Water Stress: High water absorption → groundwater depletion.
- Biodiversity Decline: Birds, tubers, and natural foods vanish in eucalyptus areas.
- Monocultures worsen vulnerability to climate change.
- Economic & Social Issues
- Meagre lease incomes compared to livelihood losses.
- Landowners prefer leasing to mills rather than to tribal farmers → tribals lose access to land.
- Tribal youth shifting away from dongar → cultural erosion.
Resistance & Revival Efforts
- Living Farms NGO:
- Active in ~200 villages.
- Working with Talia Kondhs & Kutia Kondhs.
- Promoting awareness drives on climate-resilient dongar farming.
- Reviving seed conservation and organic methods.
- Encouraging rejection of chemicals, revival of labour exchange practices.
- Community Role:
- Women and elders sharing traditional farming knowledge.
- Farmers experimenting with millet revival (ragi, maize) against cotton and eucalyptus.
Broader Context
- Millets in Danger: Despite 2023 being International Year of Millets, upland millet cultivation is collapsing under eucalyptus + BT cotton pressure.
- Climate Change Lens: Studies show monoculture plantations (perennials) more vulnerable to climate change than mixed cropping.
- Policy Vacuum:
- No strict restrictions on plantation companies leasing tribal land.
- Easy credit for eucalyptus vs neglect of millet promotion.
- Weak extension services for traditional crops.
Key Takeaways
- Eucalyptus monoculture = short-term commercial profit but long-term loss of food security, ecology, and tribal identity.
- Dongar = climate-smart, biodiversity-rich, nutrition-sustaining farming system → must be revived.
- Solution Pathways:
- Strengthen millet promotion schemes (link with MSP, PDS).
- Provide institutional credit for dongar farming.
- Legal safeguards against exploitative land leasing.
- Promote seed banks, community-based conservation, and youth involvement.
- Recognise dongar as a model of climate-resilient tribal agroecology.