
Published on Aug 8, 2025
Daily Current Affairs
Current Affairs 08 August 2025

Content
- Is the Indian economy perfectly balanced?
- How groundwater contamination is fuelling chronic illnesses
- NH Accident Crisis
- Was glacial lake breach over Dharali the trigger? Experts find some clues
- Topra Kalan
- Diabetes among older Indian adults
- Russian Oil Discount Narrows for India
Is the Indian economy perfectly balanced?
“Goldilocks Economy”
- Definition: An economic condition that is “just right” – moderate GDP growth, low inflation, and favourable monetary conditions.
- Origin of term: Derived from the “Goldilocks and the Three Bears” fairy tale — not too hot (overheating economy), not too cold (recession), but balanced.
- Implication: Sustains economic expansion without triggering high inflation or requiring restrictive monetary policy.
Relevance : GS 3(Indian Economy)
India’s “Mini-Goldilocks Moment” – Official & Market View
- Finance Ministry claim:
- Moderate inflation, strong GDP growth, and stable interest rates in 2024-25.
- GDP growth at 7.6% (FY2024).
- India’s GDP size: $3.6 trillion (end of FY2024).
- Analysts’ assessment:
- Termed it a quarterly ‘mini-Goldilocks moment’.
- Factors: Peaking interest rates, strong corporate earnings, growth momentum into 2025.
Hidden Fault Lines – Why the Label is Misleading
A. Inflation – Headline vs. Reality
- CPI (General):
- Fell from 4.8% (May 2024) to 2.82% (May 2025) – appears within RBI’s comfort zone.
- CFPI (Food inflation):
- Persistently higher than general CPI, e.g.:
- Oct 2024: CPI 6.21%, CFPI 10.87%.
- Aug 2024: CPI 3.65%, CFPI 5.66%.
- Persistently higher than general CPI, e.g.:
- Impact:
- Food ~50% of household consumption for lower-income groups.
- Volatile food inflation disrupts household budgeting, savings, and nutrition quality.
- Core inflation relevance:
- Excludes volatile food & fuel; better captures persistent cost pressures (housing, education, transport).
- Net takeaway: Low headline inflation masks high volatility in essentials that hit poorer households hardest.
B. Real Wages vs. Nominal Wages
- Nominal wage growth ≠ actual purchasing power gain.
- 2023: Nominal salary hike 9.2%, real wage growth only 2.5%.
- 2020: Real wage growth -0.4%, despite nominal growth 4.4%.
- 2025 projection: Real wage growth 4% vs. nominal 8.8%.
- Why it matters:
- Inflation erodes much of the nominal gains.
- For households, 9% salary hike with 7% inflation = only 2% extra purchasing capacity.
- ILO & economists’ warning: Stagnant real wages = weak consumption demand → slows broad-based recovery.
- Result: Growing disconnect between GDP growth and household financial well-being.
C. Income Inequality
- Gini coefficient (taxable income):
- AY13: 0.489 → AY16: 0.435 → AY23 (forecast): 0.402.
- Apparent decline, but formal sector data underrepresents inequality in the informal economy.
- Post-pandemic trend:
- “K-shaped” recovery – affluent & select industries thrive; lower-income groups stagnate.
- Wealth concentration:
- Surge in billionaires alongside stagnant wages for lower tiers.
- Socioeconomic effects:
- Risk of reduced social cohesion, constrained access to health & education, and weaker inclusive growth.
D. Fiscal Constraints
- Fiscal deficit path: 6.4% (2022-23) → target 4.4% (2025-26).
- Revenue deficit: 4% → target 1.5%.
- Primary deficit: 3% → target 0.8%.
- Challenges:
- Absolute deficit levels still high.
- Public debt-to-GDP: ~81% (2022-23), well above FRBM target of 60%.
- Implications:
- Large debt-servicing burden reduces space for social/infrastructure spending.
- Risk of “crowding out” private investment due to heavy govt. borrowing.
Macro Picture – Beyond the Headline
- Strengths:
- High GDP growth (7.6%), easing interest rates, declining headline CPI.
- Positive short-term investor sentiment.
- Weaknesses:
- Persistent food price volatility.
- Weak real wage growth constraining demand.
- Inequality in income & wealth distribution.
- High fiscal deficit & debt burden.
- Structural Risk:
- Growth benefits concentrated in upper-income groups & select industries.
- Potential long-term drag on inclusive and sustainable growth.
Core Takeaway
- Goldilocks label risks masking structural vulnerabilities.
- True economic health depends on:
- Sustained real income growth across all segments.
- Reduction in inequality (both income & opportunity).
- Stabilised essential goods prices.
- Fiscal consolidation without sacrificing public investment.
How groundwater contamination is fuelling chronic illnesses
Groundwater’s Central Role in India
- Share in water supply:
- 85% of rural drinking water comes from groundwater.
- 65% of irrigation water is groundwater-dependent.
- Why reliance is high:
- Seasonal monsoon variability makes groundwater a more dependable source.
- Poor surface water management and storage infrastructure.
- Perception vs. reality:
- Historically considered nature’s purest reserve, but now a major source of toxic exposure.
Relevance : GS 1(Geography ) , GS 3(Environment and Ecology)
Scale & Nature of Contamination (2024 CGWB Annual Groundwater Quality Report)
- Nitrates:
- Found in >20% of samples (from 440 districts).
- Causes: overuse of chemical fertilizers, leaching from septic tanks.
- Risk: Blue Baby Syndrome (methemoglobinemia), especially fatal for infants.
- Fluoride:
- Excess (>1.5 mg/L) in 9% of samples.
- Health: Skeletal and dental fluorosis (66 million affected; 230 districts across 20 states).
- High-prevalence areas: Rajasthan, Andhra Pradesh, Telangana, parts of Madhya Pradesh, Uttar Pradesh.
- Arsenic:
- Gangetic belt states: West Bengal, Bihar, Uttar Pradesh, Jharkhand, Assam.
- Exceeds WHO limit (10 μg/L) in many districts; in Bagpat (UP) recorded 40 mg/L (4,000× safe limit).
- Risks: Skin lesions, cancers (skin, bladder, liver, kidney, lungs), gangrene, neurological issues.
- Uranium:
- Found in Punjab, Andhra Pradesh, Rajasthan; in Malwa region >WHO limit (30 μg/L).
- Sources: phosphate fertilizers, excessive groundwater pumping.
- Health: Chronic kidney damage, organ toxicity.
- Iron:
- 13% samples above safe limit.
- Health: Gastrointestinal issues, developmental disorders.
- Heavy metals (lead, cadmium, chromium, mercury):
- Sources: industrial effluents, mining.
- Risks: developmental delays, anaemia, immune suppression, neurological damage.
- Pathogens:
- From sewage/septic leaks; outbreaks of cholera, dysentery, hepatitis A & E.
Real-world Groundwater “Death Zones”
- Budhpur, Baghpat (UP) – 13 deaths in 2 weeks from kidney failure; linked to industrial effluent contamination (paper & sugar mills).
- Jalaun (UP) – Petroleum-like fluids in hand pump water due to suspected underground fuel leaks.
- Paikarapur, Bhubaneswar – Faulty sewage treatment plant led to mass illness in hundreds.
Public Health Impacts
- Chronic diseases: skeletal deformities, neurological decline, cancers, kidney/liver failure.
- Acute outbreaks: waterborne diseases in peri-urban & rural belts.
- Children at highest risk: developmental impairment from fluoride, lead, nitrate poisoning.
- Geogenic + anthropogenic interplay: natural presence of arsenic/fluoride worsened by over-extraction & pollution.
Why the Crisis Persists – Structural Gaps
- Weak legal coverage:
- Water (Prevention and Control of Pollution) Act, 1974 barely covers groundwater contamination.
- CGWB: no statutory enforcement powers.
- Institutional fragmentation:
- CGWB, CPCB, SPCBs, Ministry of Jal Shakti operate in silos.
- Lack of coordinated, science-based interventions.
- Resource constraints:
- SPCBs underfunded, lack trained manpower & lab facilities.
- Regulatory loopholes:
- Industries operate with minimal oversight, low compliance checks.
- Poor monitoring:
- Sparse sampling, no real-time public data, weak health-surveillance integration.
- Over-extraction link:
- Falling water tables concentrate contaminants and trigger geogenic toxin release.
Key Statistics to Note
- Fluoride: 66 million affected; 9% of 15,259 samples exceed WHO limit.
- Nitrate: 56% of districts exceed safe limits; 28% rise in nitrate-toxicity hospital admissions (2018–2023).
- Arsenic: 1 in 100 in affected regions highly cancer-vulnerable.
- Uranium: 66% of sampled sites in Malwa region unsafe for children.
Reform Priorities
- Legislative overhaul:
- Enact National Groundwater Pollution Control Framework with binding enforcement powers.
- Integrated governance:
- Merge efforts of CGWB, CPCB, SPCBs into coordinated national task force.
- Modern monitoring:
- Install real-time sensors, expand sampling network, public data dashboards.
- Polluter accountability:
- Strict effluent standards, mandatory zero-liquid discharge for industries.
- Health response:
- Targeted remediation (defluoridation, arsenic removal plants), nutrition programs, alternate safe water supply.
- Sanitation reform:
- Upgrade rural/peri-urban sewage systems, regulate septic tank maintenance.
- Community engagement:
- Citizen water-testing drives, groundwater literacy campaigns.
Bottom Line
- India’s groundwater crisis has shifted from quantity to quality.
- It is silent, invisible, and often irreversible in damage.
- Without urgent, coordinated action, contamination will translate directly into avoidable deaths, disease burden, and economic loss.
NH Accident Crisis
Scale & Severity of the Issue
- First 6 months of 2025:
- Accidents: 67,933
- Deaths: 29,018 (≈54.7% of 2024’s total fatalities already reached in half a year)
- Annual comparison:
- 2023 → 53,630 deaths in 1,23,955 accidents
- 2024 → 53,090 deaths in 1,25,873 accidents
- If 2025 trend continues, fatalities may surpass 58,000–60,000 by year-end — the highest in recent years.
- Share in national road fatalities: National highways (NHs) account for ~30% of road accident deaths, despite comprising only ~2% of India’s total road network.
Relevance : GS 2(Social Issues , Health , Governance)
Key Observations from Data Trends
- High fatality rate: Deaths per accident on NHs are significantly higher than on other roads due to higher vehicle speeds and traffic volumes.
- Stagnant or worsening safety: Despite safety drives, fatalities on NHs have not seen meaningful reduction between 2023–2024, and 2025’s pace indicates deterioration.
- Potential under-reporting: Data is based on state/UT inputs to the eDAR portal — while this improves accuracy, actual figures may be higher due to delays or omissions in reporting.
Government’s Recognition & Measures
- Official target: Halve total road accident deaths by 2030, aligning with UN SDG 3.6.
- Remedial actions (short- & long-term):
- Road markings, signage, crash barriers, raised pavement markers.
- Geometric improvements & junction redesigns.
- Spot widening of carriageways.
- Construction of underpasses/overpasses.
- Root cause acknowledged: Road engineering faults identified as a primary factor; Minister Nitin Gadkari has publicly criticised poor quality designs by consultants.
Structural Challenges
- Design flaws: Poor curvature, inadequate shoulder space, abrupt junctions, and faulty merging lanes.
- Speed & enforcement gap: Lack of effective automated enforcement on speed limits and lane discipline.
- Mixed traffic hazards: NHs are used by both high-speed vehicles and slow-moving traffic (tractors, two-wheelers, animal carts), increasing collision risks.
- Infrastructure vs. safety lag: Rapid NH expansion under Bharatmala has outpaced equally robust safety integration.
- Maintenance gaps: Faded road markings, poor lighting, and potholes persist on certain stretches.
Social & Economic Impact
- Human cost: ~80 deaths/day on NHs alone in Jan–June 2025; many victims in economically productive age groups (18–45 years).
- Economic loss: India loses 3–5% of GDP annually due to road accidents (World Bank, 2021).
- Healthcare burden: Overstretching trauma care facilities along major corridors.
- Ripple effects: Loss of breadwinners, increased dependency ratios, and impact on household incomes.
Way Forward – Evidence-Based Solutions
- Engineering audit: Mandatory independent safety audit before and after NH construction.
- Speed management: AI-based speed enforcement, variable speed limits based on traffic/weather.
- Separation of traffic streams: Dedicated lanes for slow-moving vehicles on NHs in high-risk stretches.
- Black spot elimination: Time-bound removal/redesign of all identified accident-prone spots.
- Post-crash care: Golden Hour policy with GPS-linked ambulances and trauma centres every 50 km.
- Community awareness: Targeted campaigns for NH users, particularly truckers and two-wheeler riders.
- Accountability in design: Penal provisions for consultants/contractors in case of accidents linked to design defects.
Was glacial lake breach over Dharali the trigger? Experts find some clues
Geographical & Geomorphological Context
- Location: Dharali village, Uttarakhand, near Kheer Ganga River.
- Terrain:
- Glaciated region in upper catchment.
- Presence of deglaciated valleys bounded by end moraines (glacially deposited sediment ridges).
- Alluvial fan at Dharali — formed from debris deposition of past floods/landslides.
- River Characteristics: Steep gradient — increases velocity and destructive potential of floods.
Relevance : GS 1(Geography ), GS 3(Disaster Management)
Possible Causes of Disaster (Hypotheses from Experts)
- Glacial Lake Outburst Flood (GLOF) Scenario:
- Evidence:
- September 2022 satellite images show past lake formation signatures above end moraine.
- Meandering stream above end moraine suggests low-gradient, ponding-prone terrain.
- Deglaciated valley features indicate possible historical impoundment.
- Trigger: Landslide from end moraine blocking drainage, forming lake; later breach due to glacier mass movement or instability.
- Outcome: Sudden release of water and debris → flash flood and mudflow.
- Evidence:
- Glacial Snout Detachment:
- NDMA’s alternative hypothesis: Partial collapse of glacier nose carrying large sediment load downstream.
- Landslide Reactivation:
- Landslide 2 km upstream reportedly reactivated, potentially blocking and then breaching river channel.
Contributing Factors
- Geological Vulnerability:
- Unstable moraines and steep slopes.
- Past flood and debris flow evidence in Kheer Ganga basin.
- Anthropogenic Stress:
- Rapid commercialisation & tourism infrastructure on alluvial fan (unstable landform).
- Construction of Dharasu–Gangotri highway increasing slope instability and altering drainage.
- Climate Link:
- Possible link to glacier retreat and increased meltwater ponding due to warming.
Disaster Dynamics
- GLOF Mechanics:
- Dam formation (by moraine/landslide) → water accumulation → dam breach.
- Steep channel → high energy flood with sediment and debris entrainment.
- Alluvial Fan Vulnerability:
- Channels can shift during floods, spreading destruction beyond main river course.
- Floodwaters in steep terrain travel rapidly, giving minimal early warning.
Remote Sensing & Investigation
- Current Effort: NDMA coordinating with National Remote Sensing Centre (NRSC) for sharper pre-disaster imagery to confirm lake presence and breach dynamics.
- Indicators to be checked:
- Pre-disaster water body size and location.
- Landslide activity on moraines or adjacent slopes.
- Glacier snout changes (fracture, retreat).
Broader Significance
- Early Warning Needs:
- Regular monitoring of high-risk glacial lakes in Uttarakhand using satellites.
- Mapping of unstable moraines and slope movement zones.
- Land-use Regulation:
- Avoiding infrastructure and dense settlements on alluvial fans in Himalayan valleys.
- Climate Adaptation:
- Integrating glacial hazard mapping into tourism and highway development plans.
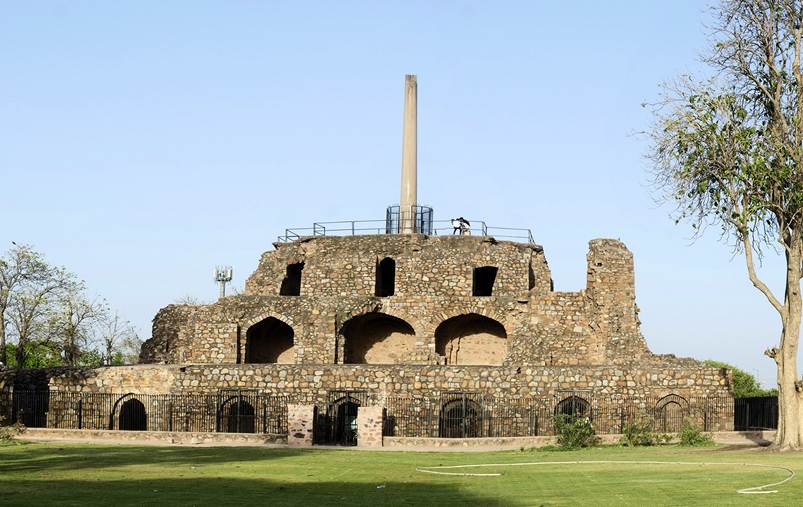
Topra Kalan
Geographical & Historical Context
- Location: Topra Kalan village, Yamunanagar district, Haryana; ~14 km from Yamunanagar city and ~90 km from Chandigarh.
- Historical Significance:
- Original site of the Delhi-Topra Ashokan Pillar carrying Emperor Ashoka’s moral edicts.
- Pillar moved to Delhi in the 14th century by Sultan Firoz Shah Tughlaq.
- Referenced by Sir Alexander Cunningham (first DG of ASI) and Hiuen Tsang (7th-century Chinese Buddhist scholar) as a major Buddhist activity centre.
Relevance : GS 1(Heritage , Culture , History)
Recent Discoveries (2024–2025)
- Artifacts Recovered:
- Painted Grey Ware (PGW): Typically dated to 1200–600 BCE, linked to late Vedic culture.
- Black-and-Red Ware, Black-on-Red Ware, Black Ware: Associated with Chalcolithic to early historic phases.
- Stamped pottery, moulded bricks, beads: Indicates craft specialization and urban organization.
- Structural Remains:
- Possible dome-like structure (hypothesized Buddhist stupa).
- Buried walls, platforms, room-like enclosures in varied orientations, at depths of 4–5 m (dense habitation layers).
- Shallow wall formations at 0.2–0.8 m depth (later-period constructions).
Chronological Insights
- Estimated Age: Site likely dates back to ~1500 BCE — nearly 3,500 years old.
- Cultural Sequence:
- Early occupation with PGW (Late Vedic period).
- Mauryan-era Buddhist activity (3rd century BCE).
- Continued habitation into medieval period (Firoz Shah Tughlaq’s relocation of Ashokan Pillar).
Ground Penetrating Radar (GPR) Findings
- Survey Conducted: January 2025 by IIT Kanpur, led by Prof. Javed Malik.
- Purpose: Map sub-surface features without excavation.
- Revealed:
- Well-planned settlement layout.
- Multi-layered construction suggesting successive cultural phases.
- Large, buried architectural elements supporting long-term, organized settlement.
Buddhist Connection
- Evidence supports Topra Kalan as a Buddhist hub in Mauryan times:
- Hypothesized stupa remains.
- Historical accounts from Hiuen Tsang describing Buddhist establishments in the region.
- Link to Ashoka’s moral edicts pillar.
Archaeological & Preservation Challenges
- No Excavation Yet: Site lies under a densely populated village — relocation is complex and sensitive.
- Local Reports: Residents have unearthed PGW, red ware, and other artifacts during house construction.
- Risk: Construction without archaeological supervision could damage remains.
Tourism & Cultural Heritage Potential
- Ashoka Edicts Park:
- 27-acre park in Topra Kalan.
- Houses a 30-foot Ashoka Chakra replica (India’s largest, recognised by Limca Book of Records, 2020).
- Proposal: Reconstruction of four ancient stupas at the park to boost Buddhist heritage tourism.
- Strategic Relevance: Fits into India’s Buddhist circuit tourism initiatives, linking with sites like Sarnath, Nalanda, and Rajgir.
Significance of Findings
- Archaeological Importance:
- Extends known habitation in Yamunanagar region back to Late Vedic period (~1500 BCE).
- Strengthens Haryana’s position in India’s early historic and Buddhist heritage map.
- Cultural Continuity: Shows transition from Vedic settlement to Mauryan Buddhist influence to medieval Islamic period.
- Policy Implication: Need for non-invasive archaeological methods (e.g., GPR, resistivity surveys) in populated heritage sites.
Diabetes among older Indian adults
Basics & Context
- Study Source: Lancet Global Health, based on Longitudinal Aging Study in India (LASI), 2017–2019.
- Sample Size: ~60,000 adults aged 45 years and above, nationally and state-level representative.
- Focus: Prevalence, awareness, treatment, and control of diabetes in India’s ageing population.
- Significance: First large-scale nationally representative survey linking self-reported and measured diabetes prevalence in older adults.
Relevance : GS 2(Health , Governance)
Key Findings – Prevalence
- Overall Prevalence: ~20% of adults aged ≥45 years had diabetes in 2019.
- Gender Parity: Men – 19.6%; Women – 20.1% (negligible difference).
- Urban–Rural Gap: Urban – 30% prevalence; Rural – 15% (2x higher in urban).
- Regional Variation:
- Highest rates (age-adjusted): Chandigarh (36.9%), Puducherry (36%), Kerala (36%).
- Highest absolute numbers: Tamil Nadu (6.1M), Maharashtra (5.8M), Uttar Pradesh (4.7M).
- Southern States: Higher prevalence; Central & NE States: Lower prevalence.
Awareness & Diagnosis
- Undiagnosed Burden: ~20 million Indians aged ≥45 years had undiagnosed diabetes.
- Unaware Patients: 40% of diabetics did not know they had the disease.
- Elderly (60+) Undiagnosed: ~8%.
- Awareness Rate: ~60% of diabetics knew of their condition.
Treatment & Control
- Treatment Coverage: Once aware, 94% received treatment – a high compliance rate.
- Control Rates (among those diagnosed):
- Glycaemic control: 46%
- Blood pressure control: 59%
- Lipid-lowering medication use: Only 6% (low, despite cardiovascular risk).
- Treatment Status:
- Untreated diabetes: 5% of ≥45 population.
- Under-treated diabetes: 47% of diagnosed cases.
- Adequately treated diabetes: 36%.
Public Health Implications
- Epidemiological Transition: Rising prevalence linked to economic development, urbanisation, sedentary lifestyles, dietary changes.
- Screening Gap: High undiagnosed proportion → Need for universal screening in primary healthcare.
- Awareness-to-Treatment Conversion: Strong (94%) → Campaigns can have significant impact.
- Control Gaps: Even with treatment, less than half achieve optimal blood sugar control; lipid management grossly neglected.
Policy & Programmatic Takeaways
- Scale-up Priorities:
- Universal diabetes screening for ≥40 age group.
- Strengthen NPCDCS (National Programme for Prevention & Control of Cancer, Diabetes, Cardiovascular Diseases & Stroke).
- Integrate diabetes detection into Ayushman Bharat Health & Wellness Centres.
- Regional Targeting: Focus on high-prevalence southern & UT regions with preventive interventions.
- Comorbidity Approach: Combine diabetes care with hypertension & dyslipidaemia management to reduce CVD risk.
- Health Education: Community-level lifestyle modification awareness – diet, exercise, weight control.
Strategic Outlook
- LASI Wave 2: Will follow up same cohort for better longitudinal insights into detection, treatment, and control trends.
- Global Context: India is part of the global surge in type-2 diabetes prevalence; WHO and IDF project further increases without intervention.
- Silver Lining: High treatment compliance post-awareness suggests that the key bottleneck is early detection, not willingness to seek care.
Russian Oil Discount Narrows for India
Background: Russia’s Oil Discount to India
- Pre-Ukraine war (pre-Feb 2022):
- Russian oil’s share in India’s crude imports: ~2%.
- No significant discount; India primarily imported from Middle East suppliers (Iraq, Saudi Arabia, UAE).
- Post-invasion scenario:
- Western sanctions forced Russia to sell crude at heavy discounts to non-Western buyers.
- Discount for India peaked at >$12/barrel vs. Middle Eastern grades in 2022-23.
- Share of Russian oil in India’s imports rose sharply to 35–40%.
- Savings in FY24: $7–10 billion in oil import bill.
Relevance : GS 3(Energy Security )
Recent Change: Discount Erosion
- 2024-25 levels:
- Discount narrowed to $2–3/barrel (Morgan Stanley) or ~$2.2/barrel (Nomura).
- Causes:
- Increased competition for Russian crude from other Asian buyers.
- Logistics costs, sanctions enforcement, and Russia’s better access to “shadow fleets” reducing urgency to discount.
- Impact:
- Economic advantage to India from Russian oil purchases has reduced drastically.
- Potential import bill increase if fully replaced: ~$1.5 billion/year (Nomura).
- Diversification to West Asian/Brazilian crude could raise prices by ~$4–5/barrel, but global oil prices in 2025 are ~$9 lower than 2024 average — cushioning the blow.
US Tariff Escalation and Link to Russian Oil
- Donald Trump’s trade stance:
- Imposed secondary sanctions-like tariffs on India for Russian oil and defence purchases.
- Tariff hike:
- August 1: +25% on Indian goods.
- August 7: Additional +25% (total 50%).
- Effective from August 27, 2025.
- Targeted sectors:
- Goods categories where India competes with Vietnam, Bangladesh, and China — but India now faces higher tariff barriers (50%) compared to their 19–30% range.
- Exempted categories (pharma, electronics) form ~50% of India’s $80 billion US goods exports.
- Global double standards:
- China imported $56.26 billion worth of Russian oil in 2024; EU imported $25.2 billion in Russian oil — yet US penalties focus on India.
Current Indian Import Adjustments
- Russian oil imports falling:
- July 2025: 1.6 million barrels/day from Russia — down 24% from June (Kpler).
- State-run refiners cutting purchases more sharply than private refiners.
- US crude imports rising:
- Since May 2025: ~225,000 barrels/day (double early 2025 levels).
- Potential to scale to 300,000 bpd (2021 highs).
- Likely diversification sources:
- Traditional Middle East suppliers (Iraq, Saudi Arabia, UAE).
- Latin America (Brazil).
- USA (light sweet crude, strategic alignment).
Economic and Policy Implications
- Oil import bill:
- Immediate rise minimal due to low current global prices.
- Risk: Diversification may push global prices higher, adding ~$1.8 billion to India’s bill for every $1/barrel global price rise.
- Domestic inflation:
- Retail pump prices likely to be kept constant by government.
- Under-recoveries absorbed by public-sector oil marketing companies (OMCs), with possible later government compensation.
- Fiscal deficit:
- Nomura sees no major upside risk to FY25 target (4–4.4% of GDP).
Strategic Dimensions
- Geopolitical balancing:
- Reducing dependence on Russian oil may ease US pressure, open space for better trade terms with US energy exports.
- But complete halt to Russian oil unlikely due to cost, logistics, and strategic partnership considerations.
- India–Russia cooperation beyond oil:
- Ongoing talks on rare earths, critical minerals, aluminium, fertilisers, and railway transport.
- Areas of advanced tech cooperation: wind tunnel facilities, small aircraft piston engines, carbon fibre, additive manufacturing.
- Rare earth minerals context:
- China controls 85–95% of global rare earths; recent Chinese export restrictions have hit Indian automobile production.
- Diversifying supply from Russia could reduce strategic vulnerability.
Risks and Outlook
- Short-term:
- Discount erosion removes Russia’s cost advantage.
- Tariff escalation by US could hit Indian exports by 40–50% in certain categories.
- Medium-term:
- Supply diversification feasible with minimal inflationary impact if global prices remain soft.
- Risk of global price uptick from India’s pivot away from Russia.
- Long-term:
- India’s energy strategy will likely involve a multi-supplier basket to balance cost, security, and geopolitics.
- Greater emphasis on US crude imports and non-Middle East diversification.
- Continued Russia cooperation in non-energy sectors to maintain strategic ties.