

Content
- Is India’s 8.2% Growth Sustainable?
- Satellites, Science, and the New Fight for Spectrum in Space
- Russia’s Su-57 Offer and India’s Tepid Response
- Appointment of the Chief Information Commissioner
- Deepavali Enters UNESCO’s Intangible Heritage List
- Western Tragopan Breeding Project Gives the Endangered Species Breathing Space
- Top 10% Earners in India Get 58% of National Income – World Inequality Report 2026
Is India’s 8.2% Growth Sustainable?
Why is it in News?
- India reported 8.2% GDP growth, with quarterly output rising to ₹48.63 lakh crore — significantly higher than last year.
- The IMF simultaneously assigned India a ‘Grade C’ for the quality of national income statistics, flagging systemic data issues.
- This combination raises the core question: Is high growth masking deeper structural weaknesses?
Relevance
GS-III – Indian Economy
- GDP measurement accuracy; statistical system reforms
- Structure of growth: sectoral composition & productivity
- External vulnerabilities: CAD, exports, geopolitical risks
- Inflation management & monetary stability
- Fiscal consolidation; tax buoyancy; quality of expenditure
- Demand patterns: PFCE, rural–urban divergence
- Employment vs growth mismatch
- Institutional capacity in economic governance
GS-II – Governance
- Data quality & transparency in public institutions
- Federal fiscal data gaps; state-level accountability
- Role of RBI and independent institutions in economic oversight
Basics: What Does 8.2% GDP Growth Represent?
Indicators of genuine momentum
- Manufacturing: +9.1% → factories closer to capacity, rising industrial demand.
- Services (60% of GDP): +9.2% → financial services +10.2% → strong credit flow, urban demand.
- Real GVA: ↑ from ₹82.88 lakh cr → ₹89.41 lakh cr → growth not driven by inflation alone.
- Nominal GDP: up 8.8% → implies inflation subdued.
- PFCE: +7.9% → households spending more.
- Agriculture: +3.5% → better reservoirs, horticulture; slight rural recovery.
- Inflation: slipped below RBI target by end-2024-25 → macro stability.
- Banking: strong credit growth, clean balance sheets, high capital buffers.
- Fiscal side: consolidation continues; GST + direct taxes strong.
- External sector: small CAD, robust services exports, diversified FX reserves.
Conclusion:
Short-term growth is broad-based, stable, and non-inflationary. India is outpacing most major economies.
The IMF’s ‘Grade C’: Why It Matters
The IMF was not grading the growth rate, but the statistical architecture behind the numbers.
Key deficiencies
- Base year outdated (2011–12) → distortions in measuring structural shifts.
- Use of WPI, not Producer Price Index, for deflators → inaccurate measurement of real output.
- Excessive single deflation → cyclical biases in GDP estimates.
- Large discrepancy between production vs expenditure GDP → weak coverage, especially informal sector.
- No seasonally adjusted data → unreliable quarter-on-quarter interpretation.
- Missing consolidated data for States/local bodies post-2019.
Implication:
Even if the economy is performing well, the statistical foundations are not strong enough to inspire high global confidence.
What the RBI Quietly Points Out
The RBI Annual Report (2024–25) accepts that growth is strong but flags structural constraints:
a) External vulnerabilities
- Global trade protectionism rising.
- Tariff uncertainty in key export markets.
- Geopolitical tensions reducing global demand.
b) Weak goods export engine
- Services + remittances cushion the CAD,
but India still lacks a scaled-up manufacturing exports base.
c) Currency pressures
- Rupee stable only due to RBI intervention.
- Underlying pressure from strong USD + volatile foreign capital flows.
d) Sectoral imbalances
- Mining: 0.04%
- Electricity: 4.4%
- Agriculture: 3.5%
These employ millions, yet contribute modestly to output → weak productivity.
Structural Vulnerabilities Behind the High Growth Number
1. Mismatch between employment and output structure
- Tertiary sector = 60% of GVA
- But majority of workforce still in agriculture + low-wage services → low productivity trap.
2. Uneven industrial recovery
- Electricity and mining sluggish due to weather anomalies, but they expose deeper issues:
- Low diversification
- Slower core sector momentum
- Inadequate infrastructure in resource sectors
3. Weak institutional capacity
- Data quality gaps reflect broader governance constraints.
- Inconsistent state-level fiscal data post-2019 implies weak transparency.
4. Export competitiveness
- Lacks strong integration into global value chains.
- Protectionist global climate hits Indian goods harder.
5. Domestic demand concentration
- Growth driven by urban, formal, credit-linked sectors.
- Rural consumption recovery is mild; income divergence persists.
So, Is 8.2% Growth Sustainable?
Short-term sustainability: YES
Supported by:
- Low inflation
- Strong financial system
- Fiscal consolidation
- High services momentum
- Rising consumption
- Stable external account
This momentum can continue 2–3 years if global conditions do not deteriorate sharply.
Long-term sustainability: UNCERTAIN
Because:
- Productivity growth is weak in agriculture + informal services.
- Manufacturing exports remain insufficient to support long-run high growth.
- Statistical system needs modernisation.
- Institutional and state-level fiscal capacities remain uneven.
- Employment-generation does not match GDP performance.
- External environment is becoming more hostile to trade.
Core argument from the article:
India’s pace of growth is high, but the architecture supporting growth is still catching up.
Satellites, science, and the new fight for spectrum in space
WHY IS IT IN NEWS?
- A new global race has emerged—not to reach the Moon, but to secure radio frequencies (spectrum) and orbital slots necessary for low-Earth-orbit (LEO) satellite megaconstellations.
- With over 50,000 satellites expected by 2030, the International Telecommunication Union (ITU) is under pressure as existing governance mechanisms struggle with congestion, interference, and debris.
- ITU reforms (WRC-23, ITU-R 74) aim to address spectrum coordination and space sustainability, but compliance remains limited (70% deorbiting rate).
- Megaconstellations are transforming global Internet access but risk deepening inequality and intensifying geopolitical competition.
Relevance
GS-II – International Relations & Global Governance
- ITU as a global institution; Global Commons governance
- Spectrum allocation disputes & geopolitics
- Power asymmetry: developed vs emerging nations in space rule-making
- Space as a strategic domain: communication, navigation, surveillance
GS-III – Science & Technology
- Satellite megaconstellations & LEO technology
- Space debris, orbital sustainability (ITU-R 74)
- Space economy growth & innovation
- Interference, spectrum congestion, orbital slot management

WHAT IS “SPECTRUM” AND WHY DOES IT MATTER?
a) Spectrum
- Electromagnetic frequencies used for wireless communication.
- Satellites need dedicated frequencies to transmit/receive signals without interference.
b) Most valued frequency bands
- Ku-band (12–18 GHz) → high-speed Internet
- Ka-band (26–40 GHz) → high-capacity broadband
- L-band (1–2 GHz) → GPS, navigation
Radio frequencies are so vital that spectrum = oxygen for space communication.
c) Orbital slots
- Precise physical positions in Earth’s orbit from which satellites can broadcast efficiently.
- Scarce resource → intense competition → strategic race.
d) Why both spectrum + orbit matter
- Spectrum prevents signal overlap
- Orbit ensures correct coverage footprint
MEGACONSTELLATION BOOM: SCALE OF THE RACE
Major players
- Starlink (SpaceX): 8,000+ satellites; plans for 42,000
- OneWeb: 648 satellites
- Amazon Project Kuiper: ~3,200
- China’s GuoWang: ~13,000
Market expansion
- $4.27 billion (2024) → $27.31 billion (2032)
- 25.5% CAGR driven by global broadband demand and lower launch costs.
Strategic dimensions
- Nations view megaconstellations as key for:
- Technological sovereignty
- Secure communications
- Intelligence and navigation
- Digital infrastructure dominance
WHY REGULATION STRUGGLES: ITU AND THE SPECTRUM–ORBIT CRUNCH ?
a) ITU’s role
- UN agency coordinating spectrum and orbital slots.
- Works on principle:
“Limited natural resources must be used rationally, efficiently, and economically.”
b) First-come, first-served system
- Favors wealthy operators who can file early applications.
- Late entrants (developing nations) risk losing access to prime bands/orbits.
c) WRC-23 (World Radiocommunication Conference) reforms
Key decisions:
- Resolution 8:
- Operators must notify deviations between planned vs actual deployment.
- Prevents spectrum hoarding.
- Mandatory deployment milestones:
- 10% in 2 years
- 50% in 5 years
- 100% in 7 years
Reduces speculative filings by companies seeking to lock future rights.
d) ITU under stress
- Framework designed for hundreds of satellites → now facing tens of thousands annually.
- 80% of ITU agenda today is satellite-related, revealing overload.
SUSTAINABILITY CHALLENGE: SPACE DEBRIS AND ITU-R 74
- 2023 resolution for sustainable spectrum-orbit use:
- Mandatory deorbit within 25 years post-mission.
- Compliance is only ~70%, meaning debris accumulates faster than removal.
Current orbital conditions
- 40,000 tracked objects in orbit
- 27,000+ pieces of debris (>10 cm)
- By 2030 → 50,000+ new satellites expected
Growing risk:
- Collision cascade (Kessler syndrome)
- Loss of space access for all
DIGITAL DIVIDE: PROMISE VS REALITY OF SATELLITE INTERNET
Why megaconstellations matter
- LEO satellites (150–2,000 km)
- Latency: 20–40 ms
- Suitable for telemedicine, online education, remote work
But affordability is the bottleneck
- Starlink terminal: ~$600 (₹53,000)
- Monthly subscription charges → unaffordable for rural communities.
- ITU estimates $2.6–2.8 trillion needed to close global digital divide by 2030.
Connectivity inequality
- Global Connectivity Index:
- Switzerland: 34.41
- India: 8.59
- A four-fold disparity
- 2.6 billion people still offline (2025).
Without subsidies or universal service mandates, LEO Internet may widen inequality rather than solve it.
WHERE DOES INDIA STAND?
a) India’s strategic strengths
- GSAT-N2: 48 Gbps throughput; covers remote regions (A&N Islands, Northeast).
- OneWeb: Bharti owns 39% → India embedded in global LEO ecosystem.
b) Spectrum allocation debate
- TRAI recommends administrative allocation, not auctions, for satellite spectrum.
Rationale:- Satellite spectrum is inherently non-exclusive and shared.
- Auctions could raise costs → reduce affordability → defeat universal access goals.
c) India’s dual challenge
- Secure spectrum & orbital resources internationally
- Ensure affordability domestically
Without both, India risks losing out in the new space economy.
MACRO TRENDS SHAPING THE NEXT DECADE
A. Commercial imperatives
- Internet markets + remote-region connectivity
- Real-time applications (IoT, autonomous systems)
B. Geopolitical imperatives
- Nations competing for:
- Strategic communication
- Surveillance
- Navigation independence
C. Governance imperatives
- Need for global rules on:
- Spectrum equity
- Orbital sustainability
- Fair access for emerging nations
D. Risk of future conflict
Without reform →
“Spectrum wars” → overcrowded space → unsafe, unequal, unusable orbital environment.
Su-57
WHY IS IT IN NEWS?
- Ahead of Russian President Vladimir Putin’s recent India visit, Moscow aggressively pitched major defence platforms:
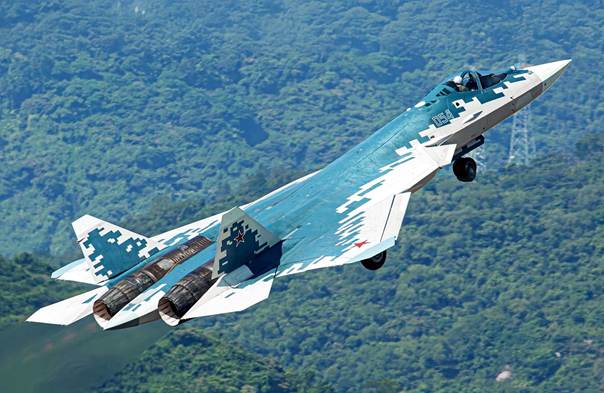
- Su-57 fifth-generation stealth fighter
- S-500 air defence system
- Geran (Shahed-136 variant) kamikaze drones
- Submarines and long-range UAVs
- India responded lukewarmly, signalling no major defence procurements despite 19 agreements signed during the visit.
- The muted response reflects India’s accelerating shift toward self-reliance (Aatmanirbharta) and declining appetite for large-ticket foreign hardware.
Relevance
GS-II – International Relations
- India–Russia defence relations: continuity & change
- Strategic autonomy; diversification of partners (US, France, Israel)
- Impact of Ukraine war on Russian export capacity
- CAATSA sanctions & geopolitical constraints
GS-III – Defence & Security
- Indigenous defence manufacturing & Aatmanirbhar push
- Evaluation of 5th-gen aircraft, drones, missile systems
- Tech transfer issues; reliability of foreign suppliers
- Naval capability building: submarines, UAVs, air defence
INDIA–RUSSIA DEFENCE RELATIONSHIP
- Russia has been India’s largest defence supplier for decades (50–60% of inventory legacy).
- Key platforms:
- Su-30MKI, MiG-29
- T-90 and T-72 tanks
- S-400 air defence
- Kilo-class submarines
- BrahMos (joint development)
- Historically based on technology transfer and long-term maintenance frameworks.
Over the past decade, however, India is diversifying suppliers and building domestic capability.
WHAT EXACTLY DID RUSSIA OFFER? WHY?
a) Su-57 (5th-gen stealth fighter)
- Russia’s flagship stealth platform; export version Su-57E.
- Earlier joint Indo-Russian FGFA project (based on Su-57) collapsed in 2018 due to Indian concerns over:
- Stealth quality
- Sensor fusion
- Engine performance
- Cost
- Technology transfer limitations
b) S-500 “Prometey”
- Next-gen long-range missile defence system (higher-tier than S-400).
c) Geran (Shahed-136 type) kamikaze drones
- Key to Russia’s low-cost attrition strategy in Ukraine.
- Capable of mass-swarm saturation attacks.
d) Submarines & long-range UAVs
- Russia seeks revival of conventional submarine deals + naval cooperation.
Why Russia is pushing these platforms
- Sanctions + Ukraine war → Russia seeks revenue, market stability, and geopolitical signalling.
- India is Russia’s largest defence partner outside CSTO, making it economically important.
WHY INDIA’S RESPONSE WAS TEPID ?
A) Strategic Shift: Aatmanirbhar Bharat in Defence
- Defence Minister Rajnath Singh highlighted:
- Production: ₹1.51 lakh crore (2024) → up from ₹46,000 crore (2014)
- Exports: ₹24,000 crore → up from < ₹1,000 crore (2014)
- India wants domestic development, not dependence on imports.
B) Preference for Indigenous Alternatives
- Drones → Indian firms already developing:
- Loitering munitions
- MALE/HALE UAVs
- Joint ventures with Israel
- Fighters → focus on
- LCA Tejas Mk1A
- AMCA (5th-gen Indian stealth fighter)
- MRFA (where U.S., France, Sweden competitive)
C) Concerns about Russian reliability
- War with Ukraine has:
- Reduced production capacity
- Created delivery delays
- Impacted supply chains & spares
- CAATSA sanctions risks add further complexity.
D) Technology Transfer Limitations
India wants:
- Full transfer of technology
- Local manufacturing
- Intellectual property access
Russia cannot fully meet these expectations for Su-57/S-500.
E) Cost & Capability Doubts
- Su-57 still under limited Russian induction; unclear combat performance.
- Geran drones considered low-tech, not aligned with India’s requirement for high-end, survivable UAV systems.
INDIA–RUSSIA DEFENCE MECHANISM UPDATE
23rd India–Russia Working Group Meeting (Oct 29, 2024)
- Co-chaired by Secretary (Defence Production) Sanjeev Kumar.
- Covered tri-service cooperation + R&D.
- Ended with a new Protocol identifying fresh collaboration areas.
However, no big-ticket deals were finalised.
Putin’s visit outcomes
- 19 agreements signed — mostly trade, energy, connectivity, logistics.
- No announcements on Su-57, S-500, submarines, or drones.
BROADER GEOPOLITICAL CONTEXT
India’s diversification
- U.S., France, Israel, and domestic suppliers increasingly relevant.
- Quad-related tech cooperation rising.
- Russia wants to retain strategic foothold.
Russia’s own constraints
- Ukraine conflict drains resources.
- Export commitments hard to meet.
- Sanctioned supply chains delay deliveries.
Chief Information Commissioner
WHY IS IT IN NEWS?
- The Prime Minister, the Leader of the Opposition (LoP) in Lok Sabha, and the Union Home Minister met to finalise appointments to the Central Information Commission (CIC).
- The panel has to select a new Chief Information Commissioner and eight Information Commissioners.
- The meeting also discussed names for vacant Vigilance Commissioner posts in the Central Vigilance Commission (CVC).
- Rahul Gandhi reportedly submitted a dissent note on some proposed names.
- The meeting coincided with a Lok Sabha debate on electoral reforms, where concerns were raised regarding appointment processes for independent constitutional/statutory bodies.
Relevance
GS-II – Polity & Governance
- Statutory bodies under RTI Act (CIC)
- Appointment process; balance between executive & LoP
- Transparency, checks & balances, institutional independence
- Role of CVC; anti-corruption oversight
- Issues of vacancies & backlog in quasi-judicial bodies
GS-II – Separation of Powers
- Judicial interventions on appointments (e.g., EC judgment 2023)
- Autonomy of oversight institutions
WHAT IS THE CENTRAL INFORMATION COMMISSION (CIC)?
a) Constitutional or statutory?
- Statutory body created under the Right to Information Act, 2005.
b) Mandate
- Adjudicates appeals and complaints relating to the Right to Information (RTI).
- Ensures transparency and accountability of public authorities.
c) Composition
- One Chief Information Commissioner
- Up to 10 Information Commissioners
d) Appointment mechanism (RTI Act, Section 12(3))
Appointments are made by the President on recommendation of a committee comprising:
- Prime Minister (Chair)
- Leader of Opposition in Lok Sabha
- Union Cabinet Minister nominated by PM
In current practice, the Home Minister is often the nominated Cabinet Minister.
e) Tenure
- 3 years or until age 65, whichever earlier (after 2019 amendment).
WHY ARE THESE APPOINTMENTS SIGNIFICANT?
a) Backlog and vacancies
- Several vacancies have remained unfilled, causing delays in RTI appeals.
- Appointment of eight Commissioners + CIC is expected to reduce backlog significantly.
b) Independence of RTI regime
- CIC is central to enforcing transparency across government ministries.
- Selection must be credible, impartial, and timely to maintain public trust.
c) Wider governance context
- Occurs amid national debates on institutional autonomy, including:
- Election Commission appointments
- Vigilance institutions
- Tribunals and regulatory authorities
WHAT IS THE CENTRAL VIGILANCE COMMISSION (CVC)?
a) Statutory body
- Created under the CVC Act, 2003.
b) Mandate
- Supervises vigilance administration.
- Oversees CBI investigations in corruption cases.
c) Composition
- Central Vigilance Commissioner
- Up to two Vigilance Commissioners
d) Appointment Committee
- PM (Chair)
- Home Minister
- Leader of Opposition in Lok Sabha
Thus, the same selection arrangement as CIC.
Vacancies here also impact functioning of anti-corruption mechanisms.
Deepavali enters intangible heritage list
WHY IS IT IN NEWS?
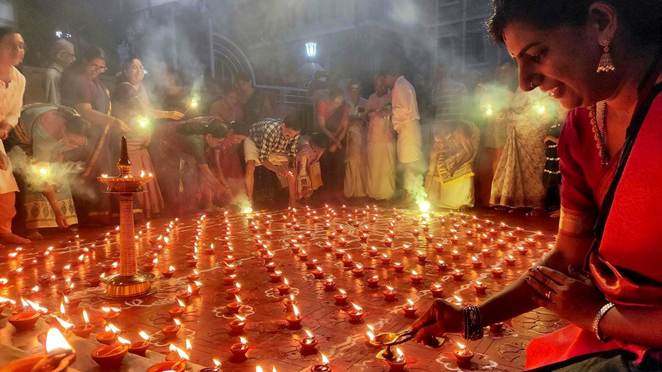
- UNESCO has officially inscribed Deepavali on the Representative List of the Intangible Cultural Heritage (ICH) of Humanity.
- The decision was announced at the 20th session of UNESCO’s Intergovernmental Committee held in New Delhi at the Red Fort.
- Delegates from 194 member states, international experts, and Indian officials, including the Union Culture Minister, participated.
- The inscription highlights Deepavali’s global cultural significance and its contribution to social cohesion and traditional craftsmanship.
Relevance
GS-I – Indian Culture
- Intangible cultural heritage (ICH) under UNESCO 2003 Convention
- Festivals as living traditions; craft ecosystems (diyas, rangoli, artisanal work)
- Social cohesion, rituals, intergenerational transmission
GS-II – International Relations
- Cultural diplomacy & soft power
- India’s increasing presence in UNESCO heritage lists
- UNESCO committees & global heritage governance
WHAT IS INTANGIBLE CULTURAL HERITAGE (ICH)?
a) Definition
Under UNESCO’s 2003 Convention, Intangible Cultural Heritage refers to:
- Living traditions, expressions, and knowledge passed across generations.
Examples include: - Festivals
- Oral traditions
- Performing arts
- Rituals
- Traditional crafts
- Social practices and community knowledge
b) Purpose of inscription
- Safeguard cultural practices
- Promote awareness and respect for cultural diversity
- Support communities preserving traditions
- Strengthen international cultural cooperation
c) Representative List of the ICH of Humanity
- A global list showcasing traditions with significant cultural value.
- Deepavali now joins the list, alongside other Indian entries such as:
- Yoga
- Kumbh Mela
- Durga Puja
- Ramlila
- Kalbelia dance
- Vedic chanting
WHAT THE UNESCO INSCRIPTION RECOGNISES ABOUT DEEPAVALI ?
a) A “living heritage”
UNESCO acknowledges Deepavali as a cultural practice kept alive by millions through:
- Community celebrations
- Intergenerational transmission
- Craft-based traditions
b) Key cultural dimensions
- Strengthens social bonds
- Family gatherings, community rituals, shared customs.
- Supports traditional craftsmanship
- Potters making traditional ‘diyas’
- Artisans engaged in rangoli, décor, textiles, metalwork
- Encourages generosity and well-being
- Charity, gift-giving, community welfare activities
- Contributes to Sustainable Development Goals (SDGs)
- SDG 11: Sustainable cities & cultural heritage
- SDG 8: Livelihoods for artisans and craftspeople
- SDG 16: Stronger social cohesion and community trust
WHY DEEPAVALI QUALIFIES AS INTANGIBLE CULTURAL HERITAGE ?
A) Wide geographic spread
- Celebrated across India and globally (South Asia, Southeast Asia, diaspora communities).
B) Multiple cultural layers
- Religious significance
- Harvest symbolism
- Seasonal rituals
- Community bonding traditions
C) Strong craft and livelihood ecosystem
- Millions of traditional workers participate in the festival economy, including:
- Potters
- Decorative artisans
- Sweet makers
- Farmers producing festival-linked crops
- Priests and local craft guilds
D) Deep continuity
- Multimillennial tradition with consistent cultural transmission.
SIGNIFICANCE OF THE INSCRIPTION FOR INDIA
1. Global recognition
- Enhances India’s cultural presence and soft power.
- Highlights India’s diversity and heritage diplomacy.
2. Preservation and documentation
- UNESCO tag encourages:
- Cultural mapping
- Safeguarding measures
- Financial and institutional support
3. Benefits for traditional livelihoods
- Craftspeople and artisans gain visibility, market value, and protection of traditional crafts.
- Opportunities for sustainable tourism and cultural industries.
4. Strengthens the RTI of culture
- Reinforces India’s role in shaping global cultural narratives.
- Enhances people-to-people diplomacy.
NATIONAL CONTEXT OF THE EVENT
- The Union Culture Minister described the inscription as a moment of immense pride.
- Special emphasis placed on the people-centric nature of Deepavali, acknowledging contributions of artisans and ordinary households.
- The Prime Minister described the recognition as reflecting Deepavali’s role in India’s cultural ethos and civilisational identity.
BROADER CONTEXT: UNESCO AND INDIA’S HERITAGE DIPLOMACY
India’s growing heritage presence
- Multiple Indian traditions have been added to UNESCO lists in recent years.
- India’s cultural diplomacy aims to highlight:
- Civilisational depth
- Community cultural practices
- Sustainable craft ecosystems
- Plurality of festivals and traditions
UNESCO ICH helps India in:
- Cultural tourism
- Global image-building
- Protection of traditional knowledge systems
- Strengthening artisan-based rural economies
Western Tragopan
WHY IS IT IN NEWS?
- The western tragopan, one of India’s rarest pheasants and the State bird of Himachal Pradesh, has shown successful captive breeding at the Sarahan Pheasantry, with 46 individuals currently maintained.
- However, experts warn that the species’ long-term survival remains uncertain because:
- Only 3,000–9,500 mature individuals survive in the wild.
- All belong to one subpopulation, increasing genetic vulnerability.
- Habitat fragmentation, climate change, and human disturbance continue to threaten wild populations.
- Reintroduction trials (2020–21) showed early signs of viability, but funding gaps and need for more research have stalled further releases since 2023.
Relevance
GS-III – Environment & Ecology
- Species conservation (IUCN Vulnerable)
- Ex-situ vs in-situ conservation
- Habitat loss, fragmentation, climate change effects
- Reintroduction protocols; genetic diversity management
- Human–wildlife interface in Himalayan ecosystems
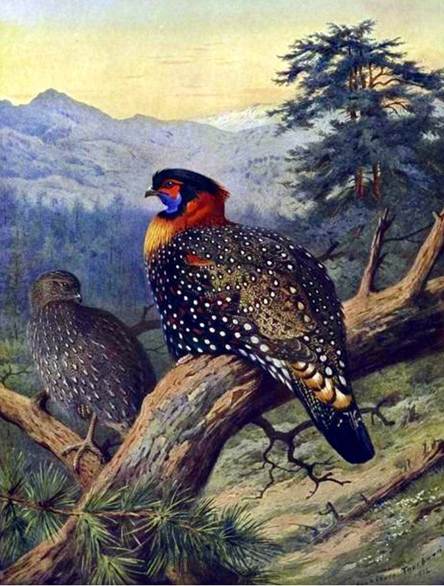
WHAT IS THE WESTERN TRAGOPAN?
a) Taxonomy
- Scientific name: Tragopan melanocephalus
- Family: Phasianidae (pheasants & partridges)
- Distribution: Historically Jammu & Kashmir, Himachal Pradesh, Uttarakhand; now restricted to fragmented Himalayan pockets.
b) IUCN Status
- Vulnerable (but with rapidly declining numbers; conservationists consider it closer to “Endangered”).
c) Habitat
- Prefers dense temperate broadleaf and conifer forests, usually between 2,000–3,600 m elevation.
d) Ecological role
- Indicator species for high-altitude forest health, sensitive to disturbance & climate variability.
POPULATION STATUS & FRAGMENTATION
a) Wild population
- 3,000–9,500 mature individuals
- All part of a single subpopulation → high extinction risk
- Distributed across western Himalayas & parts of northern Pakistan
b) Key threats
- Habitat fragmentation
- Encroachment & grazing pressure
- Climate variability disrupting breeding cycles
- Declining insect availability for chicks
- Human disturbance in breeding zones
THE MISSING LINK: IN-SITU CONSERVATION
Experts repeatedly emphasise that ex-situ breeding cannot substitute for habitat protection.
Key issues:
- Habitat loss continues → forests crucial for wild survival remain threatened.
- Breeding failures linked to climate variability:
- Warming at lower altitudes
- Unsynchronised timing between chick hatch and insect peak
- Dependence on community support:
- Locals in Pakistan voluntarily protect breeding zones
- Similar models could be explored in India
- Conservation benefits remain stagnant despite crores spent because:
- Birds were produced
- But wild habitats were not strengthened simultaneously
COMMUNITY-BASED CONSERVATION: A PROMISING MODEL
- Birdwatchers and local guides report stronger sightings in areas where villagers minimise disturbance.
- Community-based tourism provides alternative income → reduces pressure on forests.
- Examples: Rakhundi, Shilt regions
- Positive local stewardship reshapes conservation outcomes
Top 10% earners in India get 58% of national income, bottom half 15% – World Inequality Report 2026
WHY IS IT IN NEWS?
- The World Inequality Report 2026, led by economists Lucas Chancel, Ricardo Gómez-Carrero, Ravaida Mushrif, and Thomas Piketty, reveals that India’s income inequality is among the highest in the world.
- The top 10% of earners capture 58% of national income, while the bottom 50% receive only 15%.
- Wealth inequality is even sharper: the top 1% owns 40% of total wealth, and the bottom 50% owns just 6%.
- The findings mark a continued rise in inequality despite earlier improvements post-liberalisation.
Relevance
GS-III – Economy
- Income & wealth inequality trends
- Structural drivers: informality, labour markets, capital concentration
- Impact on growth quality, consumption demand, productivity
- Policy responses: taxation, social security, universal services
GS-II – Welfare & Governance
- Public service delivery gaps
- Social protection mechanisms for bottom 50%
- Fiscal policy design (wealth tax, inheritance tax debates)
WHAT IS THE WORLD INEQUALITY REPORT?
a) What is it?
- An annual global study by the World Inequality Lab, analysing distribution of income, wealth, gender inequality, and public vs private assets.
b) Why it matters?
- Provides country-wise comparable data.
- Influences global debates on taxation, welfare, job creation, and inequality.
- Uses multiple data sources: national accounts, tax data, household surveys.
KEY FINDINGS FOR INDIA (INCOME INEQUALITY)
a) Income Shares in 2024
- Top 10%: 58% of national income
- Middle 40%: 27%
- Bottom 50%: 15%
b) Historical trend
- Inequality fell after Independence → lowest in 1980s
- Rose sharply after 1991 liberalisation
- Since 2000s, India among world’s most unequal economies
c) Comparison with 2023
- Top 10% share: rose from 57% → 58%
- Bottom 50% share: marginal improvement from 13% → 15%
WHY INEQUALITY IS WORSENING
A) Structural economic factors
- High informality in labour markets → low wages
- Unequal access to education & health
- Skill-biased growth favouring tech-intensive sectors
- Concentration of corporate power and private capital
- Regional disparities (South & West more developed than North-Central regions)
B) Wealth concentration mechanisms
- Rising property prices
- High returns on capital vs wages
- Growth of billionaire wealth → tripled in 10 years
- Limited inheritance taxation or wealth taxes
C) Labour market outcomes
- Women earn only 64% of what men earn for equal work
- Unpaid labour and care burden remain high
- Agricultural wages remain stagnant despite growth in service economy
GLOBAL CONTEXT
- Inequality reduced in Asia, Europe, North America during 20th century, but:
- Since 1980, 40% of global wealth growth captured by the top 1%
- India mirrors global trend but with more extreme concentration
Geography of inequality (report highlights)
- High inequality regions:
- Middle East & North Africa
- Latin America
- India
- Sub-Saharan Africa
- Low inequality regions:
- Europe
- East Asia (Japan, South Korea)
SOCIAL & ECONOMIC CONSEQUENCES FOR INDIA
A) Economic growth quality
- High inequality → reduces consumption demand
- Limits human capital formation
- Weakens long-term growth sustainability
B) Social impacts
- Reduced social mobility
- Intergenerational inequality
- Increased risk of social tension
- Gender disparity persists
C) Policy impacts
- Public investments (health, education, skilling) face pressure
- Widening gap between urban digital economy and rural informal economy
POLICY DEBATES RAISED BY THE REPORT
Possible interventions (as per global best practices):
- Progressive taxation
- Wealth tax or inheritance tax
- Stronger taxation on capital gains & high-income groups
- Universal basic services
- Health, education, childcare reforms
- Social security for informal workers
- Labour market reforms
- Higher minimum wages
- Strengthening collective bargaining
- Gender-focused interventions
- Reducing unpaid labour burden
- Ensuring equal pay structures
- Regional balancing
- Targeted investment in backward districts
- Rural infrastructure & skilling