
Published on Nov 28, 2025
Daily PIB Summaries
PIB Summaries 28 November 2025
Content
- From Growth Engine to Global Edge: Supercharging India’s Logistics
- Tex-RAMPS
From Growth Engine to Global Edge: Supercharging India’s Logistics
What Is Logistics?
- Movement, storage, and flow of goods from producer to consumer.
- Includes transport, warehousing, cold chain, inventory mgmt, and information systems.
- Efficiency of logistics directly affects GDP, export competitiveness, supply chain resilience, and cost of doing business.
Relevance
GS2 – Governance
- Centre–State coordination under GatiShakti.
- Institutional reforms: DPIIT, MOSPI, GSTN data integration.
- Regulatory clarity through HSN mapping.
- Urban governance for freight mobility under SMILE.
GS3 – Economy / Infrastructure
- Logistics cost reduction → competitiveness.
- Multimodal transport, freight corridors.
- Industrial parks & EoDB improvements.
- Green corridors, sustainability metrics.
- Impact on exports, FDI, value chains.
Global benchmarks:
- Logistics cost for advanced economies: 7–8% of GDP.
- For India, old estimates: 13–14% (unscientific); new estimate: 7.97% of GDP (2023–24).
Big Picture: Why Logistics Is a Strategic Sector for India
- Determines India’s competitiveness in global value chains.
- Critical for Make in India, manufacturing exports, agri-produce movement, and e-commerce.
- Logistics reforms can increase GDP by 5–7% (World Bank estimates).
- India targets being a global logistics hub under National Logistics Policy + PM GatiShakti.
Key Data & Findings (PIB 2025)
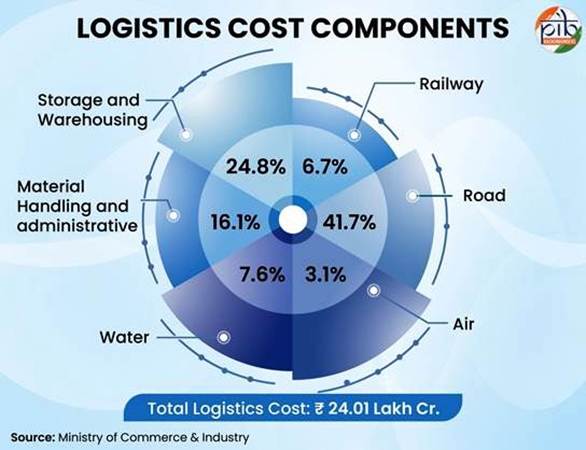
- Logistics cost: 7.97% of GDP, 9.09% of non-services output.
- Total cost: ₹24.01 lakh crore.
- Study by DPIIT + NCAER using hybrid methodology (3,500+ firms + MOSPI + RBI + GSTN).
- Smaller firms incur disproportionately higher logistics costs → competitiveness gap.
- Cost-saving lever: Multimodal integration + last-mile improvements.
Structural Transformation Underway
- Shift from fragmented ecosystem → integrated, multimodal, digital logistics.
- Removal of frictions: GST, e-Way Bill, FASTag, digital freight platforms.
- Dedicated freight corridors, revitalized waterways, modern warehousing clusters.
- Plug-and-play industrial parks → lower entry barriers, faster setup.
Digital Backbone of India’s Logistics
- ULIP: integrates 30+ departments; single API interface for logistics data.
- LDB 2.0: real-time multimodal shipment visibility (road/rail/sea/high seas).
- HSN Code Mapping: 12,167 codes → 31 ministries → accountability, trade precision.
- National Master Plan dashboards → evidence-based infrastructure planning.
Multimodal Logistics along the Gangetic Plain (Case Study)
Eastern Dedicated Freight Corridor (EDFC):
- Turnaround time of wagons: 15–16 days → 2–3 days.
- Long-haul transit time: 60+ hours → 35–38 hours.
- Digital command centre at Prayagraj.
- Cargo shift to rail = lower cost + lower emissions + reduced congestion.
- Linked to Ganga Waterway at Varanasi → multimodal synergy.
Investments:
- WB funding: $1.96 bn (EDFC + Rail Logistics) + $375 mn (Ganga Waterway).
Impacts:
- Efficient movement to Haldia, Kolkata ports.
- New warehousing clusters → jobs + better inventory management.
- Lower carbon footprint; enhanced eastern India competitiveness.
National Level Reform Pillars (2025)
A. PM GatiShakti: Integrated Infrastructure Planning
- District Master Plans in 112 aspirational districts.
- PM GatiShakti Offshore → geospatial integration for wind farms, marine infra.
- PM GatiShakti Public: access to 230 datasets for industry + researchers.
- National Master Plan dashboard + decentralized data uploading → transparency.
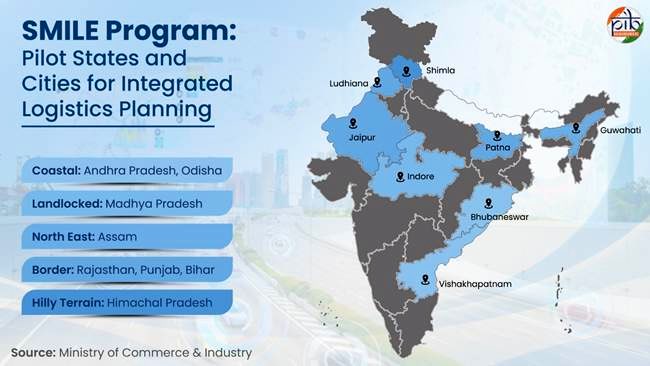
B. SMILE: City-Level Logistics Planning
- Pilot in 8 cities + 8 states, ADB-supported.
- State level → links hubs to corridors.
- City level → integrates freight with master plans and mobility policies.
- Targets: urban decongestion, low/no-emission freight, automated processes.
Outcomes:
- National model for coordinated urban freight.
- Cleaner cities, faster movement, lower logistics cost, more jobs.
C. LEADS 2025: Ranking States on Logistics
- Mix of perception + objective data (32.5% objective share, rising).
- Tracks 5–7 major corridors.
- APIs capture truck speeds, delays, bottlenecks.
- Drives competitive federalism in logistics reforms.
D. LDB 2.0: Real-Time Visibility
- Syncs with ULIP APIs.
- Tracks via container number, vehicle number, rail FNR.
- Live heatmap → identify delay zones.
- Benefits MSMEs + exporters with predictable supply chains.
E. IPRS 3.0: Rating Industrial Parks
- Grades: Leader, Challenger, Aspirer.
- Indicators: connectivity, digital readiness, green infra, skills, tenant satisfaction.
- 20 plug-and-play NICDC parks: 4 completed, 4 under construction.
F. HSN Guidebook
- 12,167 codes mapped to 31 ministries.
- Improves regulatory clarity, sector-specific oversight, negotiation leverage.
Why Logistics Matters More Than Ever ?(Strategic Lens)
- Accurate cost data → targeted policy → global credibility.
- Multimodal shift reduces dependence on trucking (currently ~70% freight share).
- Green logistics aligns with global carbon-neutral supply chain norms.
- Better logistics → lower inflation (supply-side efficiencies).
- Direct impact on export competitiveness (cost-to-export).
Strengths of India’s Emerging Logistics Architecture
- Unified digital stack unmatched globally (ULIP + LDB + e-Waybill).
- Multimodal infrastructure, especially rail + waterways synergy.
- Competitive federalism via LEADS + IPRS.
- Evidence-based planning under PM GatiShakti.
- Urban freight mainstreamed through SMILE.
Challenges That Still Need Addressing
- High variability of logistics efficiency across states.
- MSMEs disproportionately affected by high logistics costs.
- Skill gaps in supply-chain management, digital freight ops, cold chain.
- First-mile (farm/industry clusters) and last-mile (urban) still weak.
- Need for green truck fleets, EV freight, and clean inland container movement.
- Limited multimodal transport adoption by small firms.
Tex-RAMPS
What Is Tex-RAMPS?
- Full form: Textiles-Focused Research, Assessment, Monitoring, Planning & Start-up Scheme.
- Central Sector Scheme — fully funded by Ministry of Textiles.
- Outlay: ₹305 crore (FY 2025-26 to FY 2030-31).
- Aligned with next Finance Commission cycle — ensures continuity of funding and planning.
- Designed to future-proof India’s Textiles & Apparel (T&A) sector.
Relevance
GS3 – Economy / Manufacturing / Infrastructure
- Strengthens competitiveness of a major industrial sector contributing ~12% of manufacturing GVA.
- Drives industrial upgrading: smart textiles, technical textiles, circularity, digital manufacturing.
- Enhances export competitiveness through higher quality, sustainability, and innovation capacity.
- Boosts MSME productivity via data systems, diagnostics, and state-level capacity building.
- Supports Atmanirbhar Bharat, Make in India 2.0, and integration into global value chains.
- Enables evidence-based economic policymaking through ITSS, supply chain mapping, employment datasets.
- Complementary to PLI, PM MITRA, National Technical Textiles Mission → builds a 360° ecosystem.
Why Was Tex-RAMPS Needed? (Structural Gaps + Global Context)
- India’s textile sector contributes ~2.3% of GDP, ~12% of manufacturing GVA, and is a top forex earner.
- Sector suffers from:
- Low R&D spending (<1% of sectoral output).
- Fragmented data systems → weak policymaking, inaccurate employment estimates.
- Limited innovation in high-value segments: smart textiles, technical textiles, sustainable fibres.
- Weak academia–industry collaboration.
- Low start-up penetration in textile tech (compared to China, EU, Vietnam).
- Global shift toward sustainable, traceable, circular textiles → India must upgrade to remain competitive.
- Tex-RAMPS responds to these by building a research–data–innovation tripod.
Key Components (PIB + Policy Significance)
A. Research & Innovation
- Funds advanced research in:
- Smart textiles, wearable tech.
- Sustainability & circularity.
- High-performance fibres (geo-textiles, agro-textiles, medical textiles).
- Process efficiency (zero-discharge dyeing, digital printing).
- Aim: Move India up the value chain from low-cost producer → technology-intensive leader.
B. Data, Analytics & Diagnostics
- Creates robust national datasets:
- Employment census, supply chain mapping, cluster diagnostics.
- India-Size study → industry standard body-size database (benefits apparel fit, exports).
- Supports evidence-based policymaking, correcting long-standing data deficits.
C. Integrated Textiles Statistical System (ITSS)
- Real-time data + analytics platform for:
- Monitoring prices, production, logistics.
- Tracking global trends and domestic supply-demand gaps.
- Enables predictive modelling, risk alerts, and better export planning.
D. Capacity Development & Knowledge Ecosystem
- Strengthens State-level planning, cluster management, and skill systems.
- Creates a pipeline of:
- Best practices, planning templates, case studies.
- Workshops, summits, policy dialogues.
- Helps align state textile missions with national goals.
E. Start-up & Innovation Support
- Grants for:
- Incubators, accelerators, hackathons.
- Academia–industry R&D projects.
- High-value tech start-ups (AI in fashion, traceability tech, recycling).
- Builds an innovation pipeline akin to PM MITRA parks.
Expected Outcomes
- Global competitiveness:
- Boost in productivity, quality, sustainability → improved export share.
- R&D ecosystem strengthening:
- More patents, prototypes, industry-academia projects.
- Data-driven policymaking:
- Reduced information asymmetry; better cluster-level interventions.
- Employment creation:
- Especially in high-value, innovation-driven segments.
- Stronger federal collaboration:
- Centre–state alignment; national standardization of metrics.
How Tex-RAMPS Fits Into India’s Larger Textile Strategy ?
- Complements existing flagship interventions:
- PM MITRA Parks (infrastructure).
- PLI for Textiles (production & scale).
- National Technical Textiles Mission (high-value segments).
- SAMARTH (skill development).
- Tex-RAMPS fills the missing pillar: R&D + Data + Innovation.
- Together, they build a 360-degree textile modernisation ecosystem.
Economy & Manufacturing
- Moves India toward higher-value exports (technical textiles), reducing reliance on commodity apparel.
- Supports India’s goals under:
- Sustainable fashion, circular economy,
- Net-zero pathways,
- Global supply chain integration.
- Strengthens India’s pitch in trade negotiations through better data, standards, traceability.
- Aligns with Atmanirbhar Bharat and Make in India 2.0.
Comparison with Global Best Practices
- EU: Circularity mandates + green tech standards
- China: State-funded textile R&D institutes + digital manufacturing
- US: Industry–university fibre innovation hubs
- Tex-RAMPS brings India closer to these models by:
- Funding R&D,
- Creating integrated data systems,
- Linking research to markets.